When digital crop monitoring detects stress before visible damage
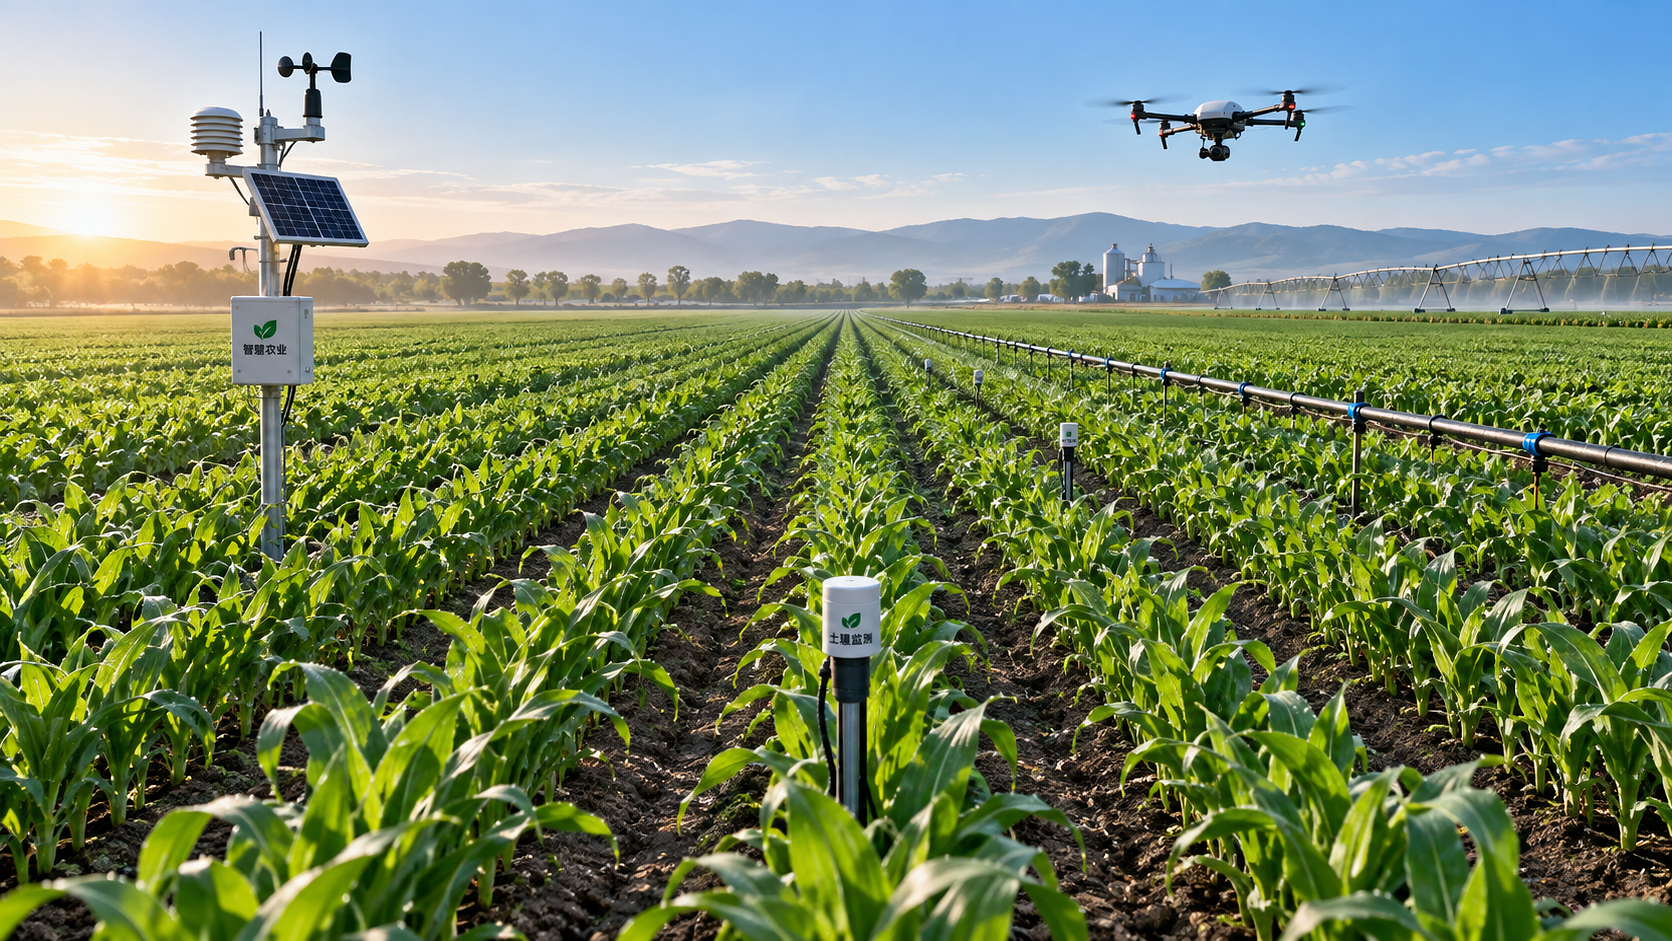




A field can look uniform from the road while parts of the crop are already under stress. Leaves may still be green, canopy cover may appear intact, and harvest quality may seem weeks away from concern. Yet the conditions that later produce uneven maturity, weak plants, contamination risk, yield loss, or poor storage performance often begin earlier as small changes in water uptake, temperature, reflectance, growth rate, or nutrient movement.
Digital crop monitoring detects stress before visible damage when it identifies a meaningful deviation from the crop’s expected condition, then confirms that deviation with reliable field evidence. It does not “see” every disease or predict every outcome automatically. Its value lies in shortening the interval between an emerging problem and a targeted inspection. For quality and safety teams, that earlier signal can prevent a minor variability pattern from becoming a wider crop-quality issue or an avoidable operational response.
What changes before a crop looks damaged?
Visible symptoms are usually late indicators. Wilting, yellowing, leaf scorch, stunting, lodging, and dead tissue occur after plant processes have already been affected. Before that point, a crop may alter stomatal activity, leaf temperature, chlorophyll response, canopy structure, root-zone water extraction, or daily growth rhythm. These changes are not always obvious during a walk-through, particularly in large fields where the affected area is small or the crop stage makes variation hard to see.
Digital crop monitoring combines measurements from more than one source to identify those earlier shifts. Depending on the farm system, useful inputs may include satellite imagery, drone imagery, in-field weather stations, soil-moisture probes, irrigation flow data, machine logs, crop-growth models, and scouting records. No single source is sufficient in every situation. A vegetation index may reveal a weak zone, but it cannot independently establish whether the cause is compaction, poor emergence, nutrient availability, disease pressure, irrigation failure, or a sensor artifact.
The practical question is not simply whether a map contains red, yellow, or green areas. The question is whether a change is unusual for that field, crop stage, weather pattern, and management history. A low-vigor zone that has remained stable since emergence may need a different response from an area where canopy performance has declined sharply over several days.
The first warning is often a mismatch, not an alarm
Early detection works best when the monitoring system compares related signals rather than treating each measurement in isolation. A soil-moisture reading may be within an acceptable range, for example, while canopy temperature rises above nearby areas under the same weather conditions. That mismatch can suggest that roots are not accessing water effectively, that irrigation distribution is uneven, or that plant transpiration has changed for another reason.
Likewise, a decline in vegetation-index values becomes more relevant when it coincides with slower growth, a change in irrigation pressure, a known field boundary, or a weather event. By contrast, an isolated image anomaly near trees, drainage channels, wheel tracks, or field edges may reflect shade, mixed pixels, exposed soil, or image-processing limitations rather than crop stress.
For quality control, this distinction matters because a monitoring alert is a priority signal, not a final diagnosis. Treating every anomaly as confirmed crop damage wastes labor and can trigger unnecessary applications. Ignoring patterns because no visible symptoms are present creates the opposite risk: intervention occurs only after product quality, uniformity, or harvest timing has been affected.
A practical response when an alert appears
When digital crop monitoring identifies a new stress pattern, the most useful response is controlled verification. The aim is to establish whether the signal is genuine, how extensive it is, and whether it relates to a process that could affect crop quality or safety.
- Confirm that the data are comparable. Check image date, cloud contamination, sensor uptime, calibration status, data transmission gaps, and the crop stage used as the reference. A comparison made across sharply different growth stages can create misleading contrasts.
- Define the affected zone. Identify whether the pattern follows irrigation lines, soil boundaries, machine passes, low-lying ground, headlands, or an irregular patch. The shape often narrows the likely causes before anyone enters the field.
- Compare with a nearby reference area. A useful reference zone has similar crop age, variety, management, and exposure but does not show the alert. Comparing affected and unaffected plants in the same field is usually more informative than judging a plant against a generic visual standard.
- Inspect both plants and the root zone. Record crop stage, canopy density, leaf appearance, pest evidence, root development, soil moisture, infiltration, odor, standing water, crusting, and mechanical damage. Do not inspect leaves only; many early stress drivers originate below ground.
- Review recent operations. Irrigation changes, fertilizer placement, spraying, cultivation, harvest traffic, drainage work, or equipment adjustments can explain sudden spatial patterns. Operational records should be available to the person interpreting alerts.
- Classify the finding. Separate sensor or imagery artifact, normal field variation, manageable agronomic deviation, and escalating crop-quality risk. This makes later review possible and prevents every alert from receiving the same urgency.
Why water stress is frequently detected first
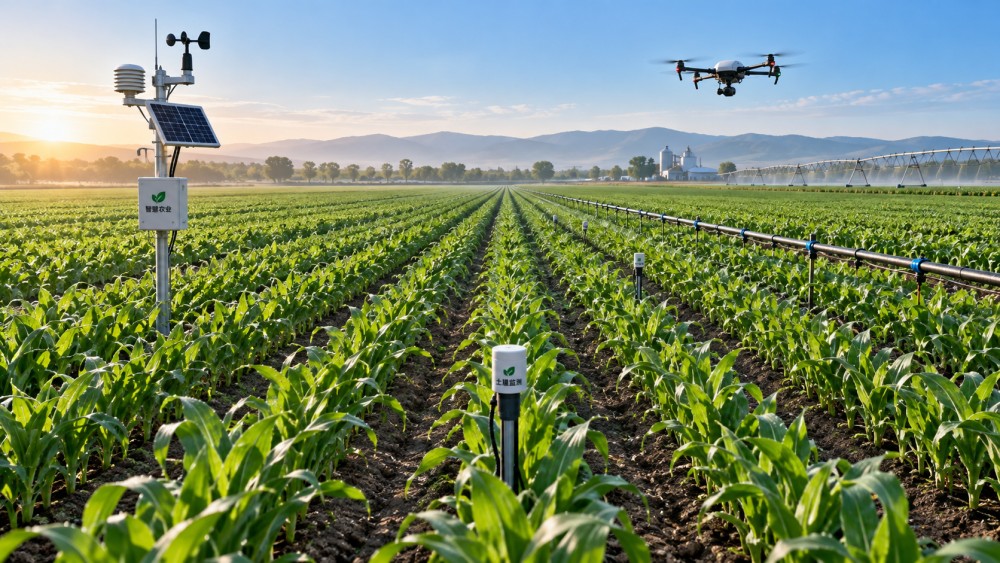
Water-related stress is often one of the earliest conditions identified by digital tools because plants respond to water availability before severe wilting becomes visible. A crop can reduce transpiration while leaves still appear normal. Thermal sensing may detect a relatively warm canopy, while soil sensors can reveal that moisture is present at one depth but unavailable where active roots are concentrated. Irrigation telemetry may show that a zone received less water than intended even though the system was operating.
However, soil moisture alone should not be used as proof of adequate water supply. A sensor may be installed in a location that does not represent the affected area, positioned at an unhelpful depth, or surrounded by soil with different texture from the rest of the management zone. High soil moisture can also coexist with plant stress where oxygen is limited, drainage is poor, salts are concentrated, roots are damaged, or infiltration is uneven.
Quality teams should therefore interpret water information as a relationship among soil, plant, and irrigation-system performance. A reliable review asks: Is water reaching the intended area? Is it entering the root zone? Can roots use it? Is the crop responding as expected? The answer may require pressure readings, flow records, manual soil assessment, and canopy observations alongside digital measurements.
Nutrient and disease signals require more restraint
Digital imagery can flag an area with altered vigor before a nutrient deficiency or disease becomes visually obvious across the canopy. It cannot reliably name the cause from color variation alone. Nitrogen limitation, root restriction, waterlogging, insect feeding, foliar disease, herbicide injury, uneven emergence, and compaction can all create overlapping spectral patterns.
This is where an overly automated workflow can create risk. A map that appears to show nutrient stress should not automatically lead to corrective fertilization. Added nutrients may fail to address the actual cause, complicate crop management, or create avoidable handling and environmental concerns. Similarly, a suspected disease pattern requires field confirmation of symptoms, distribution, host condition, and contributing weather conditions before a treatment decision is made.
A stronger protocol links digital alerts to predefined inspection observations. For example, a scout record may require notes on lesion type, pest presence, lower-leaf versus upper-canopy symptoms, root color, soil smell, and whether the pattern tracks water movement or equipment traffic. This gives quality managers evidence that can be reviewed later instead of relying on a map interpretation alone.
Set thresholds around decisions, not around attractive dashboards
Monitoring programs become unreliable when alerts are based only on generic thresholds supplied by software. A meaningful threshold should correspond to an action: inspect within a defined timeframe, test irrigation performance, isolate a management zone for closer review, adjust a planned field operation, or increase sampling before harvest.
Thresholds should also reflect crop stage. A slight variation early in establishment may be expected where emergence is still uneven. The same decline during a period of rapid biomass accumulation, flowering, fruit set, or grain fill may deserve faster attention. Historical field behavior is useful, but it should not become an excuse to dismiss change. A zone known for weaker vigor can still develop a new problem.
It helps to assign alert levels according to both confidence and consequence. A low-confidence imagery anomaly may require another image or simple verification. A confirmed irrigation interruption during a sensitive crop stage may require an immediate system inspection. A recurring stress zone close to harvest may trigger additional quality sampling or harvest-segregation planning, depending on the crop and the nature of the risk.
Data quality is part of crop quality control
The value of digital crop monitoring depends on disciplined data management. Sensors drift, batteries fail, communication drops, imagery can be obscured by clouds, and field boundaries may be inaccurate. If these issues are not visible to users, false confidence can be more dangerous than having no data at all.
A defensible operating routine includes sensor installation records, calibration and maintenance checks, clear naming of fields and management zones, documented image dates, and notes explaining known anomalies. Irrigation data should be time-aligned with weather and crop observations. Where several people inspect the field, use consistent categories for plant condition and severity so that records can be compared across visits.
Traceability matters especially when stress may affect marketability, storage behavior, or the timing of harvest decisions. The goal is not to create excessive paperwork. It is to preserve the chain from digital observation to field verification, corrective action, and follow-up result. Without that chain, teams cannot tell whether an alert was useful, whether the response worked, or whether the same issue is returning.
Where early monitoring has clear limits
Digital tools are strongest at detecting patterns, change, and inconsistency across space or time. They are weaker when the crop is obscured by dense canopy, when images are too infrequent for a fast-moving event, when a sensor does not represent field conditions, or when the cause produces no measurable signal at the available resolution.
They also cannot replace direct assessment where food safety, chemical-use decisions, disease identification, or harvest acceptance depends on specific evidence. Monitoring may indicate where to sample, but laboratory testing, validated field inspection, and applicable farm procedures remain necessary when a quality or safety decision requires confirmation.
The most effective approach is therefore not “digital versus manual.” It is a layered process: remote signals identify where attention is needed; field inspection determines what is happening; operational records explain possible causes; and follow-up monitoring shows whether the condition is stabilizing, worsening, or responding to action. Used this way, early detection becomes a practical control point rather than another stream of unverified data.
Related News
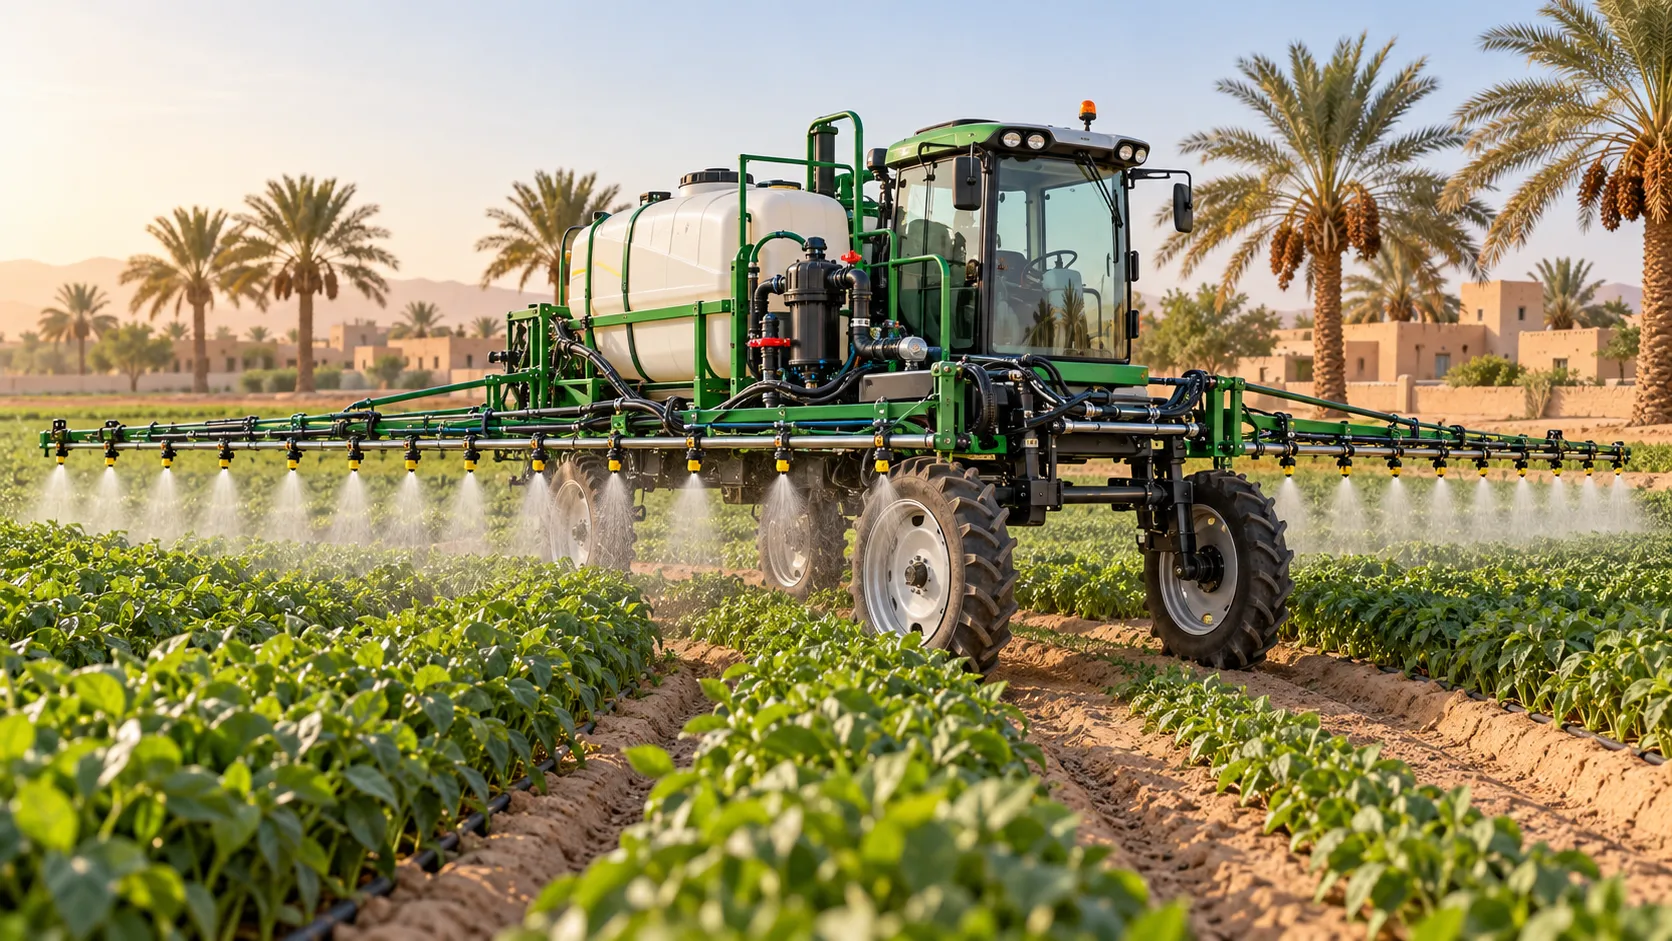
Choosing Crop Protection Equipment for Hot, Windy Middle Eastern Farms
Compare crop protection equipment Middle East farms need for hot, windy conditions. Discover key nozzle, drift-control, and durability checks to choose the right sprayer.
Choosing an Agriculture 4.0 Supplier: Compatibility, Support, and Total Cost
Choose an Agriculture 4.0 supplier with confidence. Learn how to verify compatibility, assess support, and compare total ownership costs to avoid hidden fees and costly downtime.
Low-Pressure Drip Irrigation: How to Fix Uneven Watering Without Raising Pressure
Optimize low pressure water-saving irrigation systems: discover how to fix uneven watering, clear blockages, and reduce hydraulic losses without raising supply pressure.
Comparing Farm Equipment Supplier Quotes: Price, Freight, and Warranty
Simplify supplier comparison for farm equipment price: assess freight, field-ready costs, and warranty coverage. Learn how to avoid hidden charges and choose a reliable supplier.
Choosing a Digital Farming Platform Provider: Compatibility and Data Ownership
Compare digital farming platforms providers on equipment compatibility, data ownership, and export rights. Discover practical checks to avoid lock-in and choose with confidence.
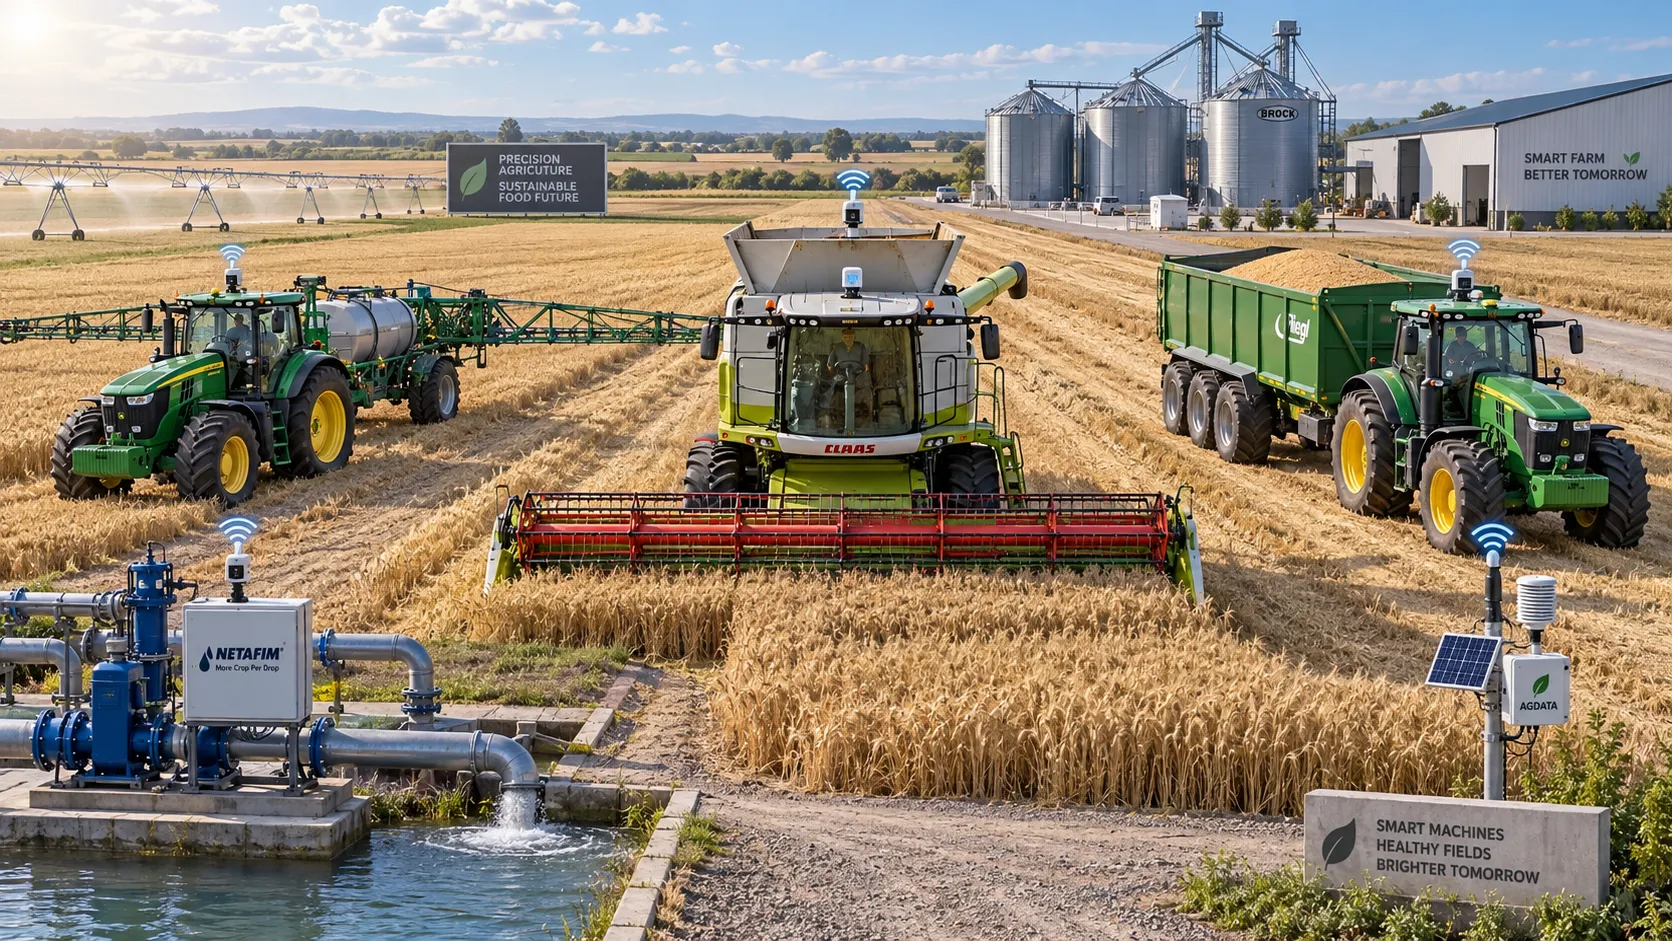
How Large-Scale Farm Telematics Cuts Downtime Across Mixed Fleets
Large-scale farm equipment telematics cuts mixed-fleet downtime with real-time alerts, smarter maintenance, and stronger operational control. Learn how to protect critical farm workflows.
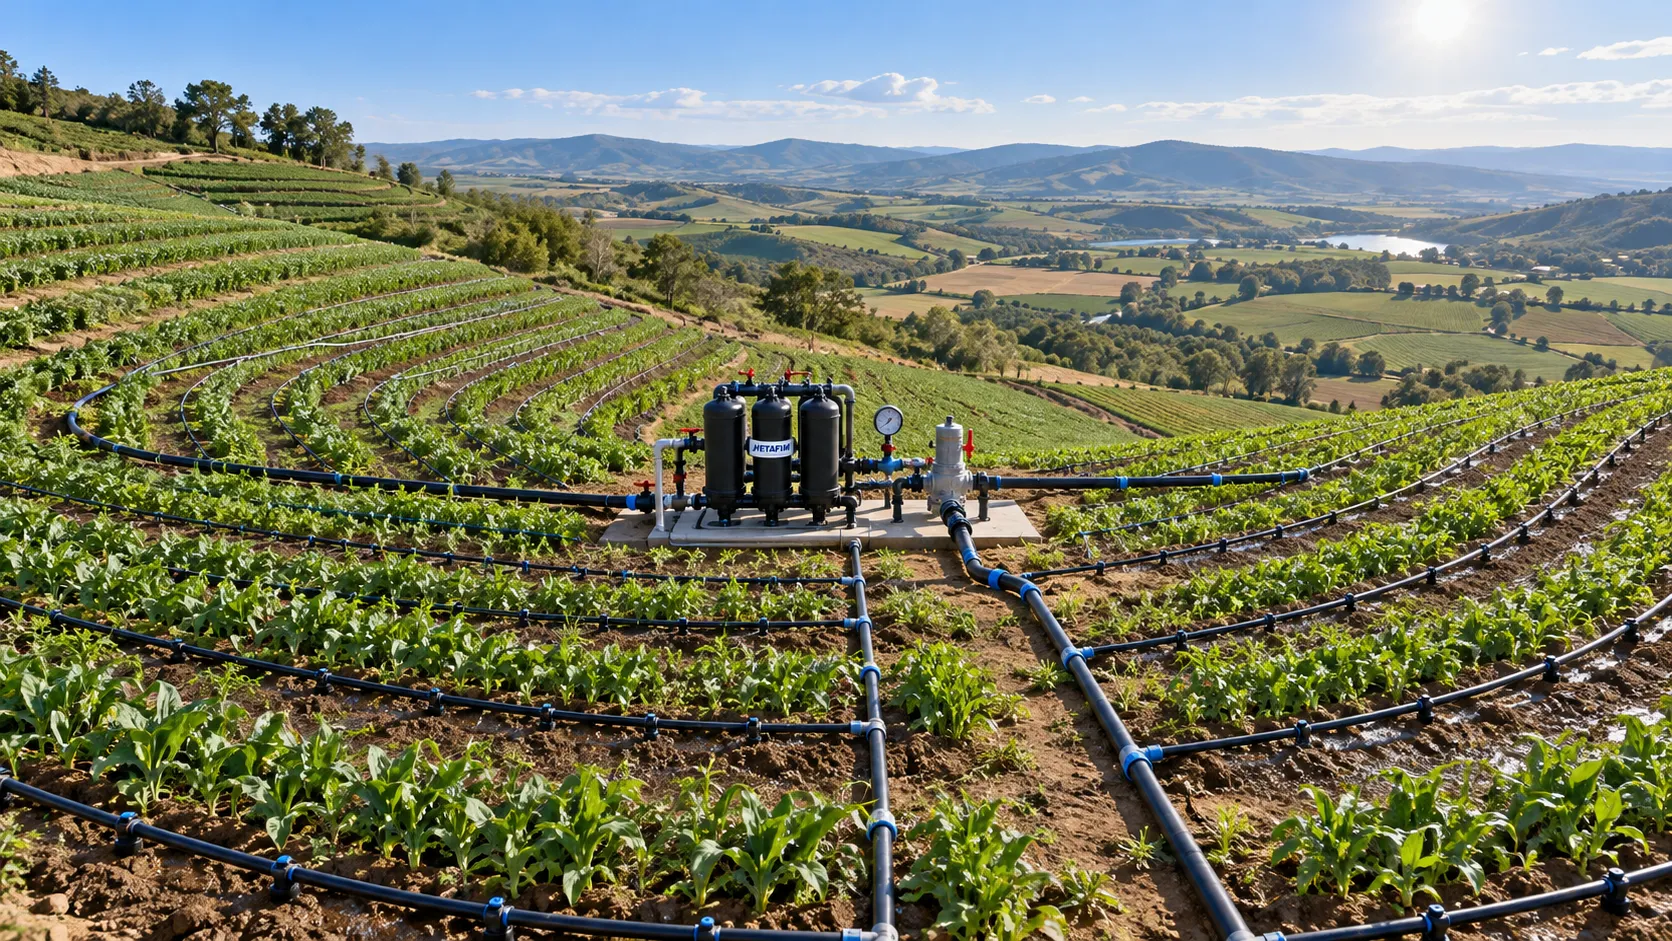
How to Size Low-Pressure Water-Saving Irrigation Systems for Uneven Fields
Low pressure water-saving irrigation systems for uneven fields: learn zoning, pressure mapping, pipe sizing, and pump selection to improve uniformity and reduce water waste.
Farm Machinery Sourcing: How to Vet Suppliers, Specs, and Lifecycle Costs
Farm machinery information for sourcing: learn to vet suppliers, compare specifications, control lifecycle costs, and secure reliable uptime for smarter equipment purchases.
How telemetry for agriculture helps identify equipment downtime
Telemetry for agriculture helps detect early warning signs, prioritize maintenance, and reduce costly equipment downtime before field operations are disrupted.
Related News
- 00
0000-00
When digital crop monitoring detects stress before visible damage - 00
0000-00
How to Evaluate Dynamic Feedback Algorithm Suppliers for Precision Farming Systems - 00
0000-00
How Sensor Feedback Enables Accurate Variable-Rate Fertilization in Field Conditions - 00
0000-00
How to Select Precision Crop Protection Equipment for Variable Field Conditions - 00
0000-00
How to Evaluate Precision Fertilization System Suppliers for Farm-Scale Deployment
Popular Tags
Tractor Power Architect
Weekly Insights
Stay ahead with our curated technology reports delivered every Monday.