Fuel-Efficient Farm Machinery: How to Compare Fuel Use per Hectare
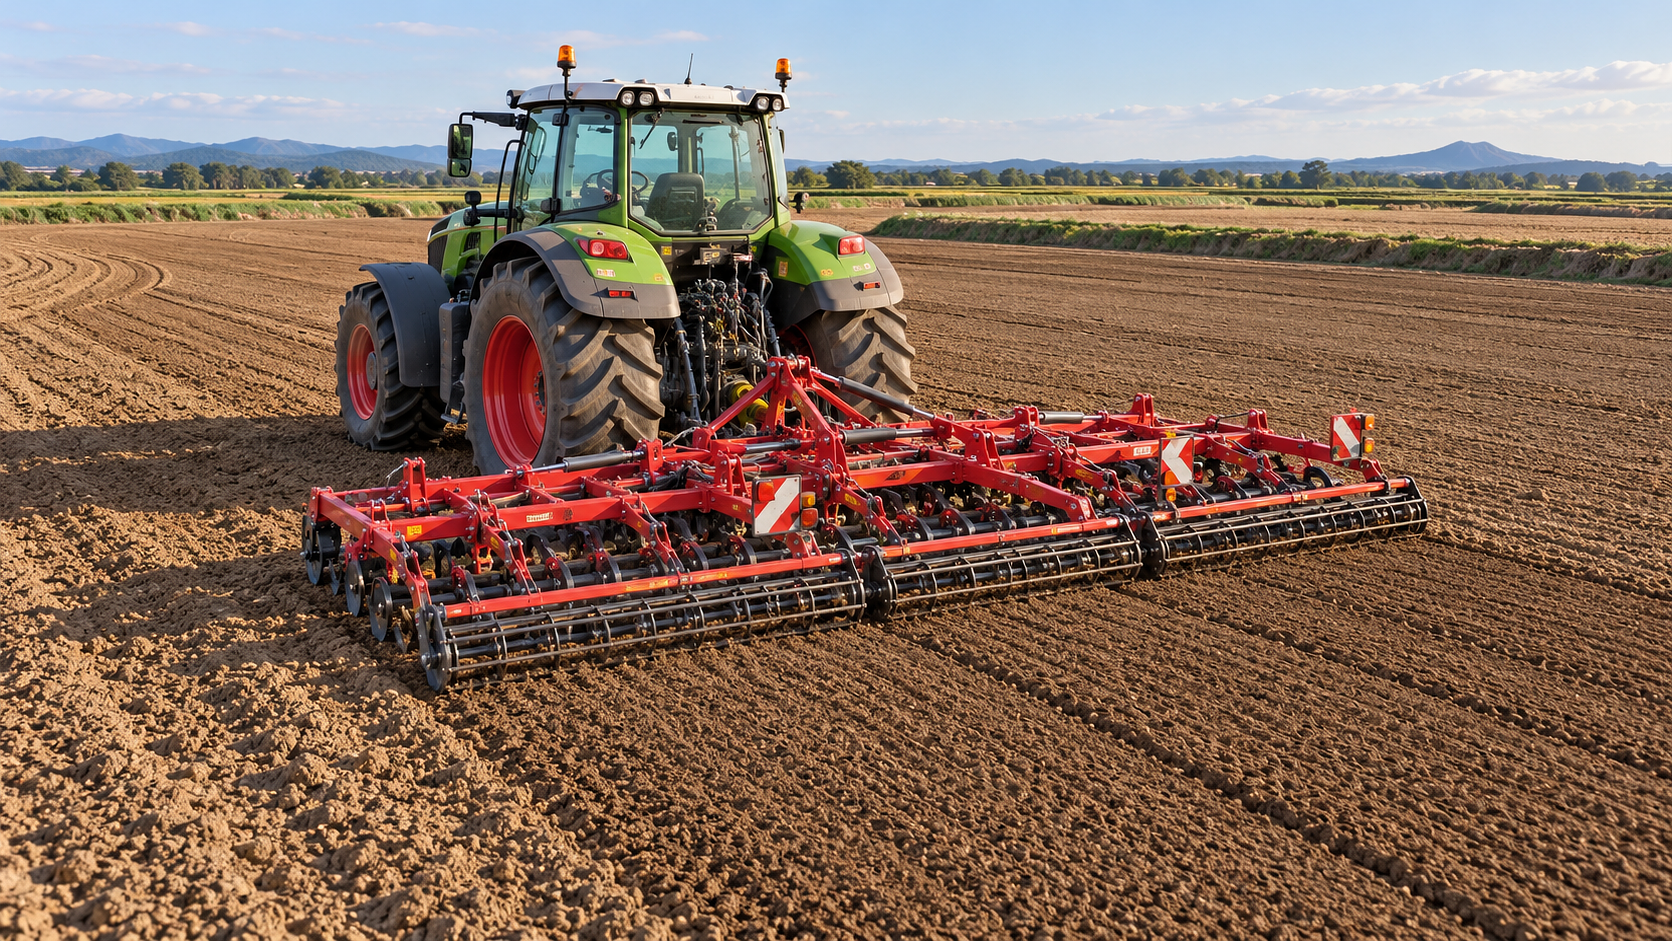




Select fuel-efficient farm machinery by comparing the liters required to complete a hectare at an agreed work quality and an acceptable work rate. A machine burning less fuel per hour can consume more per hectare if it travels slowly, works a narrower strip, or spends longer turning. A faster combination can show an attractive figure while leaving shallow cultivation, uneven application, or excessive harvesting losses.
A useful comparison therefore needs three results together: liters per hectare, hectares per hour, and verified work quality. These establish whether a fuel saving comes from efficient operation or from completing a lighter task. Engine specifications and hourly fuel readings help explain the result, but neither establishes field efficiency on its own.
Define the completed hectare before measuring fuel
The basic calculation is straightforward:
Fuel use per hectare (L/ha) = fuel consumed within the test boundary (L) ÷ unique area completed to the required standard (ha).
The denominator needs care. Repeatedly covering the same strip does not create additional hectares. GPS logs based on distance multiplied by nominal implement width can overstate completed area when passes overlap. Conversely, a field boundary includes ground that might remain untreated around obstacles or inaccessible corners. Use the unique area actually completed, with overlaps removed and untreated areas excluded.
Define the task before comparing equipment. For cultivation, specify working depth, residue conditions, and the required soil finish. For drilling, include seed placement and acceptable skips. For spraying, hold application rate and coverage requirements constant. Harvesting comparisons need agreed limits for grain loss, grain damage, and sample cleanliness. Fuel consumed while producing unacceptable work cannot support an efficiency claim.
Also establish where measurement starts and stops. Two boundaries answer different questions:
- Field-operation measurement includes productive passes, headland turns, in-field waiting, and adjustments during the operation. It reveals performance within the field.
- Whole-job measurement adds the agreed supporting activities, such as travel, refilling, loading, or unloading. Where separate support machines are included, their fuel must be recorded too.
Both are useful, but they must remain separate. Comparing one machine’s productive-pass consumption with another machine’s whole-job consumption produces a misleading ranking.
Connect hourly fuel burn to actual field capacity
Hourly fuel consumption becomes meaningful when paired with the area completed during the same interval:
Fuel use (L/ha) = average fuel consumption (L/h) ÷ effective field capacity (ha/h).
For an initial estimate, theoretical field capacity is working width in meters multiplied by travel speed in kilometers per hour, divided by 10. Effective field capacity applies a field-efficiency factor to account for losses from overlap, turning, and other nonproductive time:
Effective field capacity (ha/h) = width (m) × speed (km/h) × field efficiency ÷ 10.
Use field efficiency as a decimal. Keep its definition consistent: if effective width already deducts overlap, do not deduct that same overlap again through the efficiency factor. Likewise, average fuel consumption must cover the same elapsed period as the capacity measurement. Combining a productive-pass fuel reading with an all-field capacity figure distorts the calculation.
As a hypothetical arithmetic example, a combination consuming 24 L/h while completing 3 ha/h uses 8 L/ha. Another consuming 30 L/h at 5 ha/h uses 6 L/ha. The higher hourly consumption corresponds to lower fuel use per hectare. These figures illustrate the calculation only; they are not equipment benchmarks, and the comparison remains valid only at equivalent work quality.
For measured trials, total liters divided by completed hectares is preferable to reconstructing the result from width and speed. The capacity equation is particularly useful for explaining differences or estimating performance before field measurements are available.
Hold the workload constant enough to compare machines
Conditions that change draft, traction, or material flow can overwhelm differences between machines. Adjacent plots improve comparability, but proximity alone does not guarantee equal resistance. Soil moisture, compaction, slope, and residue distribution still need recording.
Do not force identical travel speeds when equipment is designed to work at different speeds. Hold the required output quality constant and allow each combination to operate within its suitable range. A speed advantage is a legitimate benefit if placement, depth, coverage, or harvesting losses remain acceptable.
The comparison question also determines implement choice. A common implement helps isolate differences between tractors. Comparing complete tractor–implement combinations addresses the performance of each working system. Mixing these approaches makes it difficult to attribute the saving to the tractor, implement, or operating setup.
Measure fuel without introducing a larger error than the saving
Short trials are vulnerable to measurement error. Small differences in tank fill level, machine angle, or fuel temperature can obscure the actual consumption difference. Use a measurement interval long enough for fuel consumed to be clearly distinguishable from the method’s uncertainty.
Tank-refill measurements require a repeatable filling procedure, consistent machine position, and a defined settling period. Automatic nozzle shutoff alone does not establish an identical final level. Where fuel temperature changes substantially, volume comparisons need appropriate compensation or an alternative measurement approach.
Fuel-flow instrumentation must suit the engine’s fuel system. Measuring supply flow alone overstates consumption when fuel returns to the tank; net consumption requires accounting for the return circuit. Installation must also avoid restricting flow or disrupting normal engine operation.
Electronic fuel totals are convenient for continuous logging, but displayed precision does not establish accuracy. Validate their use for the comparison against a suitable reference measurement, especially when different machine models use different estimation methods. Record the source of each fuel value so estimated and independently measured figures are distinguishable.
Synchronize fuel, position, and time records. A fuel total that includes warm-up paired with an area log starting at the first pass creates an inconsistent boundary. Record unusual events, including prolonged stops and exhaust aftertreatment regeneration where fitted. Such events belong in representative whole-job consumption, but an uneven occurrence during short trials can justify additional matched runs.
Separate productive efficiency from field-management effects
A lower whole-field L/ha figure can come from reduced turning time, better guidance, or fewer interruptions even when fuel use during productive passes is unchanged. That is a useful operational saving, but it answers a different question from improved engine or drivetrain performance.
Separate productive passes, turns, idle periods, and support activities in the records. This reveals whether the advantage will transfer to fields with different shapes or operating arrangements. Guidance that reduces overlap has more opportunity to save fuel where overlap was previously substantial; its benefit will be smaller where pass placement was already accurate.
Inspect wheel slip alongside working speed and draft conditions. Excessive slip consumes energy without equivalent forward progress. Tire pressure and ballast affect traction, rolling resistance, and soil loading, so their settings belong in the trial record. Adding ballast without confirming a traction limitation can increase resistance and fuel use.
Engine speed deserves the same contextual treatment. A suitable higher gear and lower engine speed can reduce consumption during some drawbar tasks, provided the engine maintains the required load and response. PTO-driven implements and hydraulically demanding equipment impose additional speed and flow requirements. Reducing engine speed until an implement loses performance creates an apparent saving by changing the task.
Build a trial that exposes meaningful differences
Use repeated, matched runs rather than a single pass through different parts of a field. Alternate machine order or allocate matched strips so changing soil moisture, crop conditions, and weather do not consistently favor one machine. Bring equipment to normal operating condition before the comparison period, and record setup changes between runs.
For each run, retain fuel consumed, elapsed time, unique completed area, work-quality measurements, and relevant field conditions. Calculate L/ha and ha/h from those records. When combining runs, divide total fuel by total completed area; a simple average of individual L/ha values can mislead when run areas differ.
Report the spread between runs alongside the combined result. If the apparent advantage is smaller than measurement uncertainty or normal field variation, the evidence does not establish a reliable winner. Additional matched trials are more useful than reporting extra decimal places.
Quality failures require explicit treatment. If a second pass is necessary to meet the agreed specification, include its fuel and time in the completed-job result and count the hectare once. Where correction cannot restore acceptable quality, report the failed run rather than treating it as a valid low-consumption result.
Translate the results into an equipment choice
A credible comparison presents L/ha beside effective capacity, quality results, measurement boundary, and operating conditions. Keep the supporting records detailed enough to explain the difference. A single fuel figure stripped of depth, throughput, or field layout is insufficient evidence for selection.
Compare performance across representative workloads if equipment must handle several tasks. Calculate expected fuel demand by multiplying each task’s measured L/ha by its planned treated area, counting repeated operations separately. Do not average unrelated tasks without weighting them by the actual work program.
The preferred combination is the one that uses less fuel for the required work while meeting the necessary completion window. If its advantage depends on long uninterrupted runs, light draft, or a narrow crop-moisture range, carry that condition into the selection record. That makes the result usable when the machinery reaches a different field.
Related News
Agricultural Automation Still Needs Human Oversight, Study Finds
Agricultural automation still needs human oversight. Discover how AI and smart equipment are reshaping farm jobs, skills, and decisions.
Choosing a Precision Fertilization Equipment Manufacturer: What to Check
Choose a precision fertilization equipment manufacturer with confidence. Compare accuracy, compatibility, service and total ownership costs before you buy.
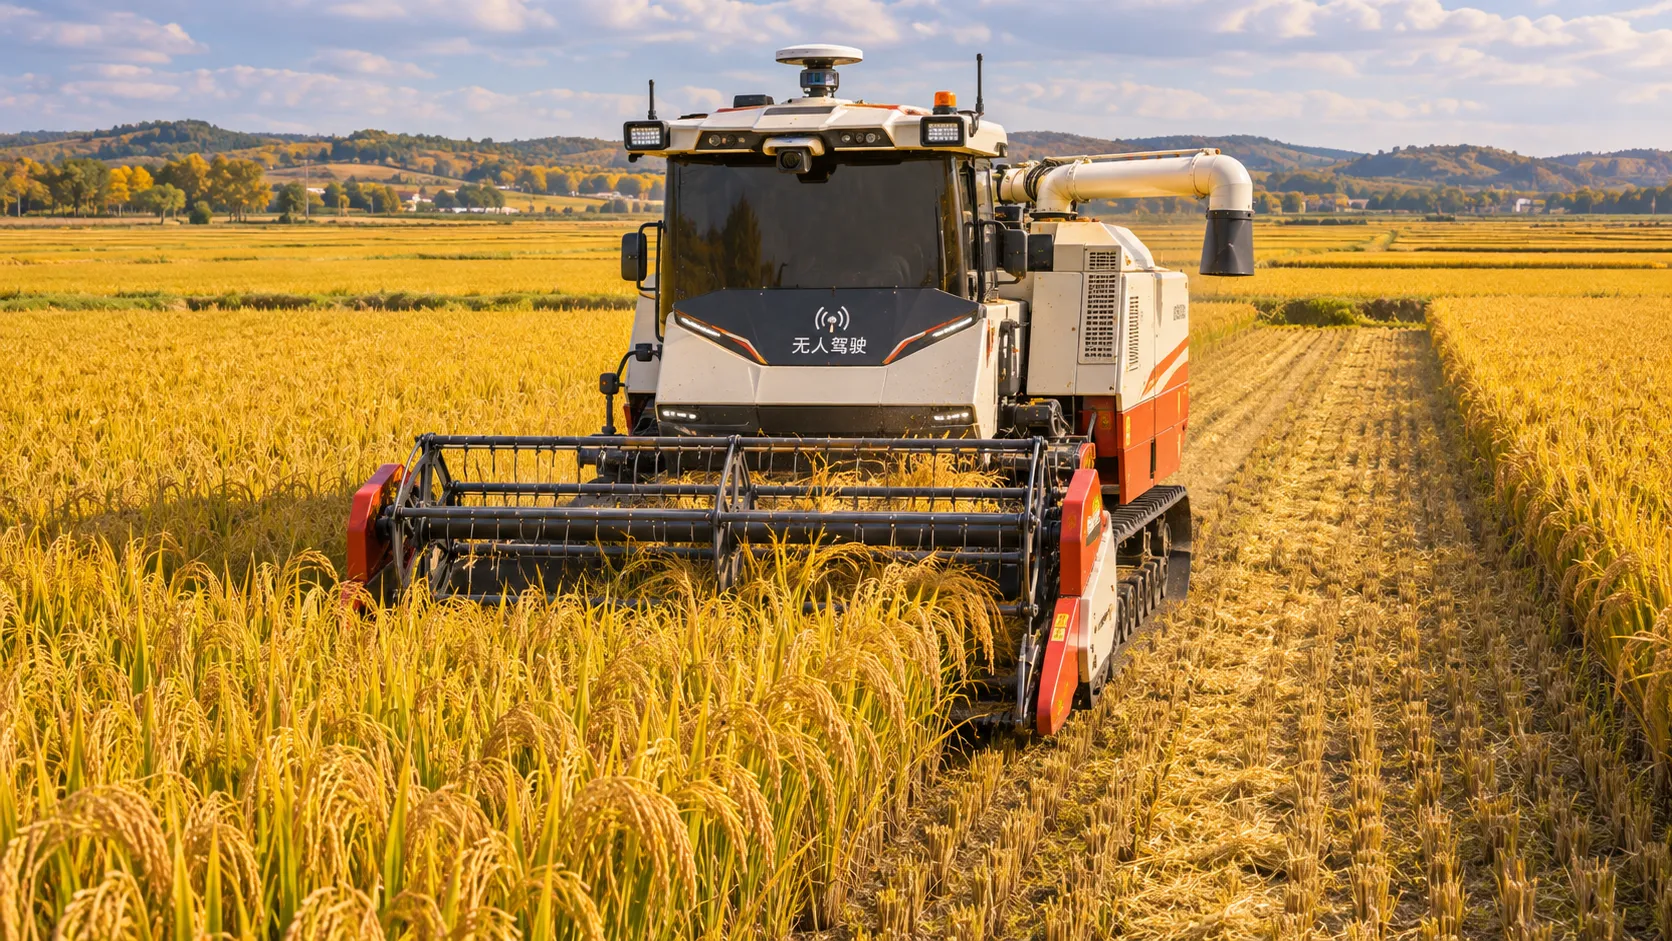
China's Autumn Grain Harvest Highlights Role of Machinery and Precision Farming
China's autumn grain harvest highlights machinery and precision farming. Explore how coordinated practices support harvesting and yield improvement.
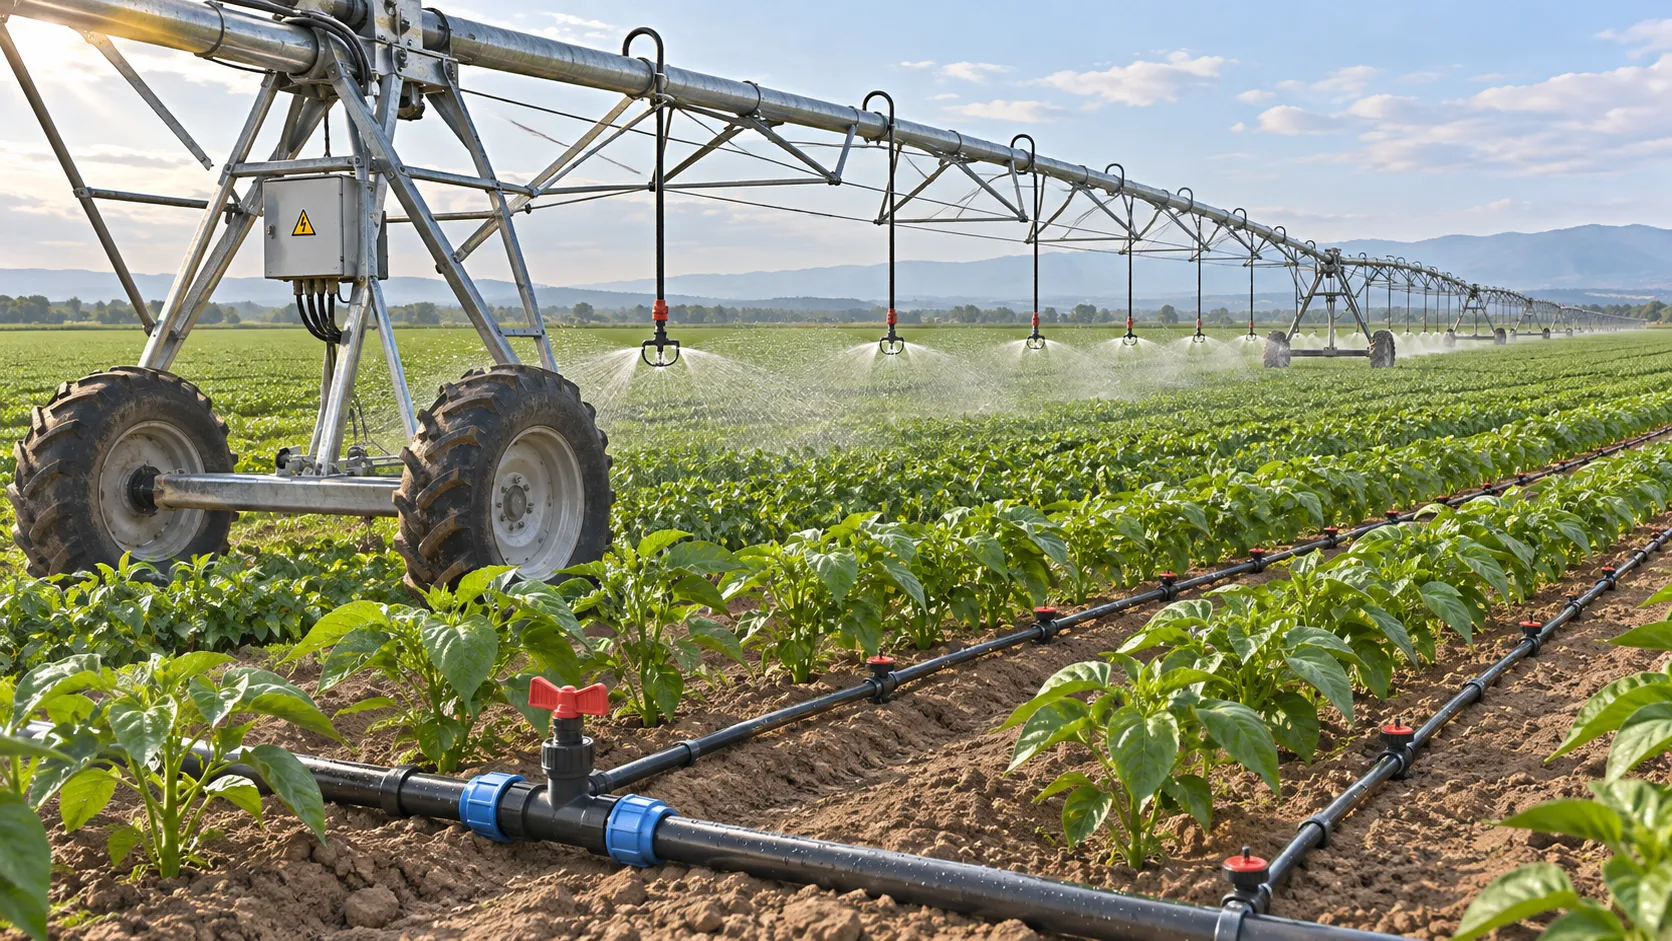
Drip vs. Center Pivot Irrigation: Maintenance Tasks and Costs Compared
Use this irrigation solution comparison by maintenance to weigh drip vs. center pivot tasks, costs and downtime—and choose the best fit for your field.
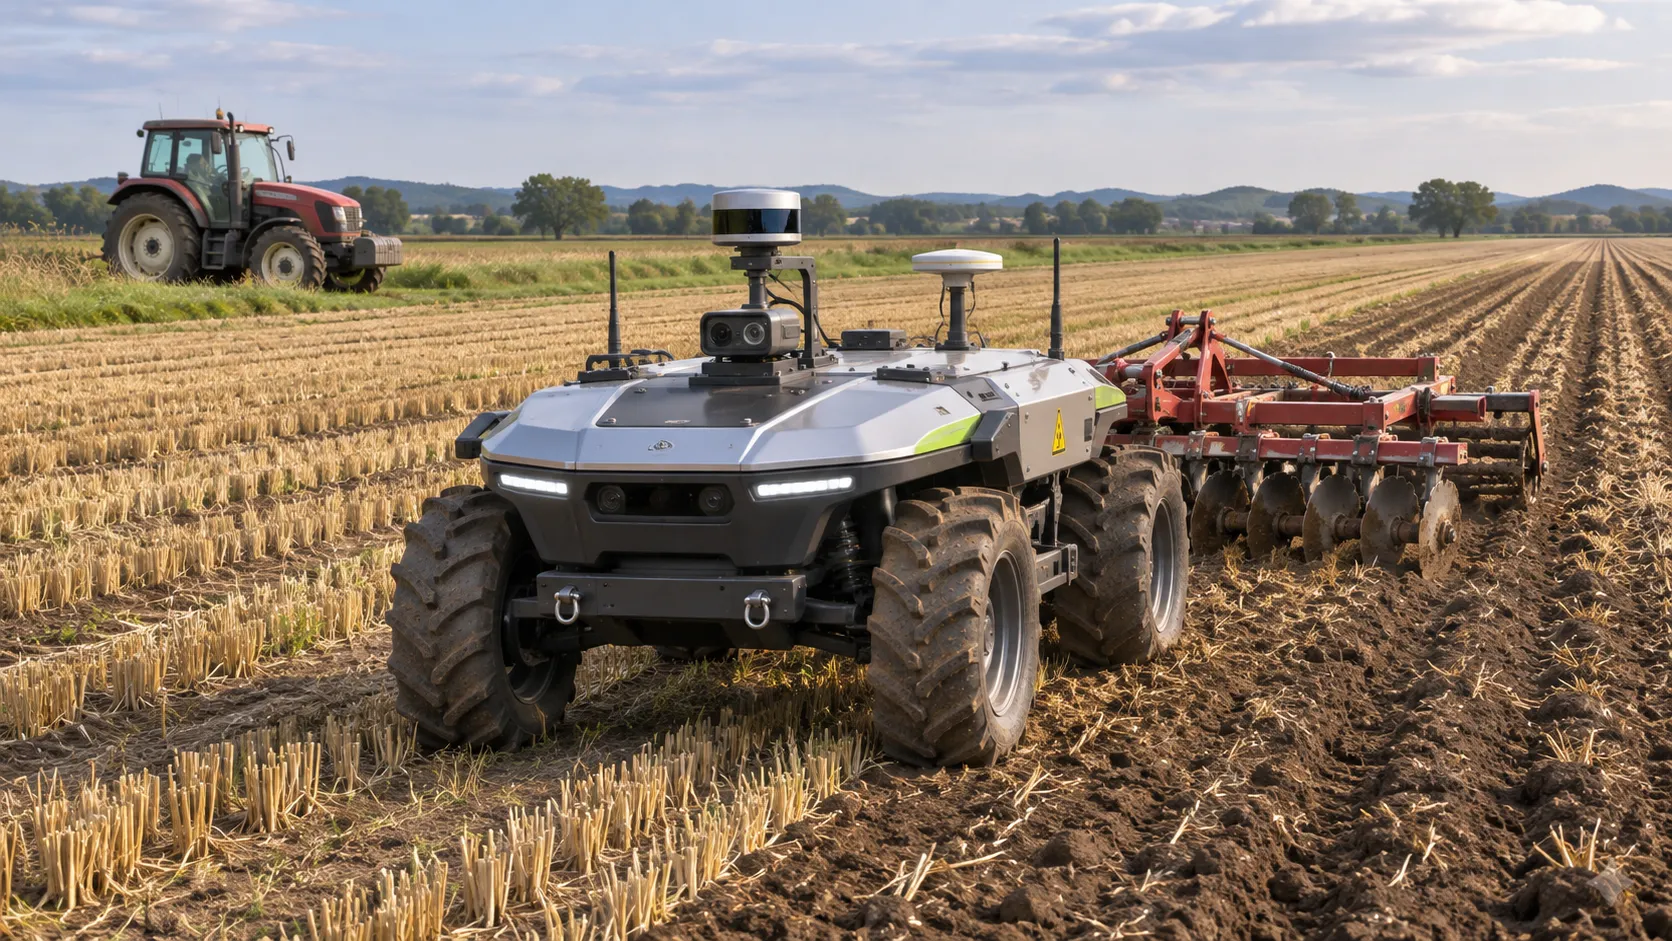
EIMA 2026: Six Tractor of the Year Awards Include Autonomous Robot
Explore the Tractor of the Year awards at EIMA 2026, featuring six winners, including the AgXeed autonomous robot and leading tractor models.
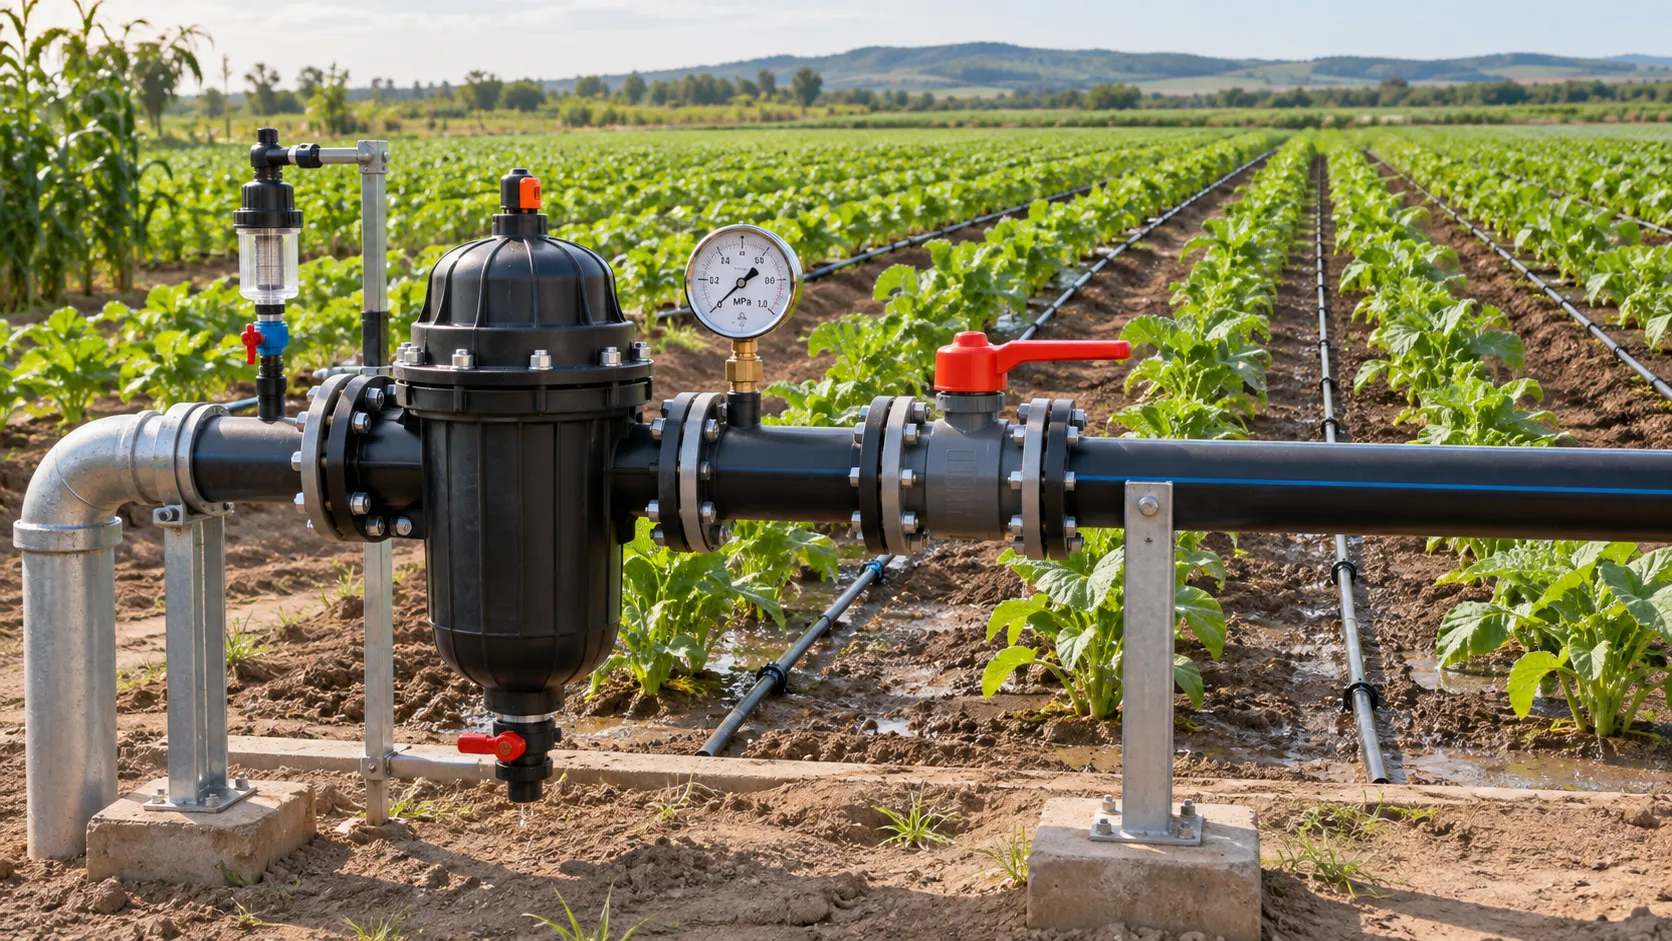
Choosing Irrigation Systems for Government Projects: Water, Cost and Compliance
What factors affect irrigation system selection for government projects? Explore water supply, lifecycle costs and compliance to make a confident, well-informed choice.
Choosing an Agricultural Machinery Platform: Listings, Pricing, and Support
Choosing an agricultural machinery platform? Compare listings, pricing, supplier verification, and support to make a more confident equipment purchase.
Ofwat Launches £8 Million Agri-Water Innovation Challenge
Ofwat’s £8 million Agri-Water Innovation Challenge supports smart irrigation, water reuse and water-saving solutions. Explore the funding and its potential impact.
Choosing a Water-Saving Irrigation Supplier: 5 Key Procurement Criteria
Choose a water-saving irrigation systems supplier with confidence. Explore five procurement criteria to reduce risk and maximize long-term value.
Related News
- 00
0000-00
Choosing Irrigation Systems for Government Projects: Water, Cost and Compliance - 00
0000-00
Choosing an Agricultural Machinery Platform: Listings, Pricing, and Support - 00
0000-00
Choosing a Water-Saving Irrigation Supplier: 5 Key Procurement Criteria - 00
0000-00
304 vs 316 Stainless Steel for Ingredient Processing Equipment - 00
0000-00
Choosing a Large Farm Equipment Exporter: Parts, Shipping and Warranty
0000-00
Popular Tags
Ms. Elena Rodriguez
Weekly Insights
Stay ahead with our curated technology reports delivered every Monday.