Farm Machinery Platform Comparison: Key Data, Integration, and Service Gaps
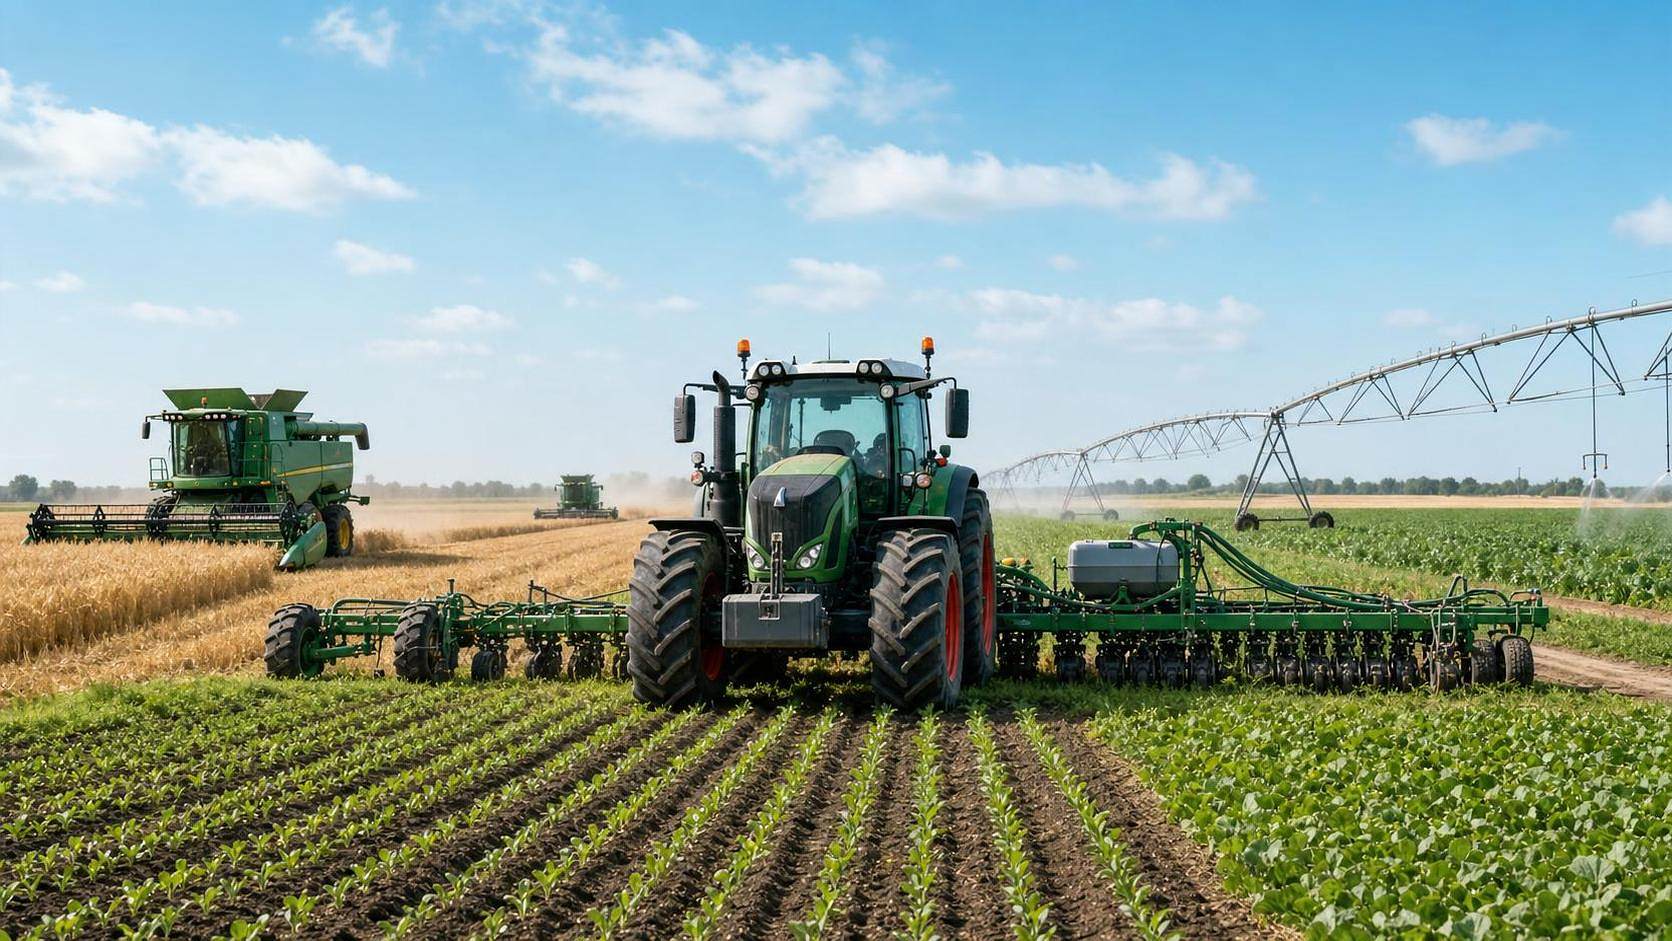




A strong farm machinery platform comparison now depends on more than a feature checklist. Data visibility, integration depth, and service execution shape whether equipment performs reliably across seasons, fields, and operating models.
That shift matters because modern agri-equipment is no longer a set of isolated machines. Tractors, combines, intelligent tools, and irrigation systems increasingly share data, software logic, and maintenance workflows.
In practice, a platform that looks competitive on paper may still create blind spots in machine health, agronomic feedback, or dealer support. Those gaps can distort procurement decisions and weaken long-term interoperability.
For that reason, any farm machinery platform comparison should examine the full operating environment. AP-Strategy has framed this well by linking mechanical performance, precision algorithms, and sustainability demands into one decision context.
What a platform comparison really covers
A platform is not only the machine interface. It includes telemetry architecture, controller compatibility, agronomic data flows, remote diagnostics, firmware management, and service coordination.
This is why a farm machinery platform comparison must look at both hardware and digital layers. High horsepower or wide cutting width says little about how well the system behaves within a connected operation.
The scope often spans five connected areas. Large-scale machinery drives field throughput. Combines translate harvesting efficiency into loss management. Tractor chassis support traction and hydraulic stability. Smart tools deliver prescription tasks. Irrigation networks close the loop on water use.
When these areas are evaluated separately, the picture stays incomplete. The better approach is to test how they exchange data and support coordinated decisions over time.
Why the issue has become more urgent
Agriculture 4.0 has raised expectations for traceability, automation, and resource efficiency. The market now rewards platforms that can turn machine output into operational intelligence without adding friction.
Regulatory pressure also plays a role. Environmental reporting, fuel efficiency targets, and water stewardship requirements are pushing fleets toward more measurable and more connected performance.
At the same time, climate variability is making field conditions less predictable. A combine setting, irrigation schedule, or tractor power map may need rapid adjustment across different soil, crop, and moisture conditions.
This is where the farm machinery platform comparison becomes strategic. The question is no longer which machine looks advanced. The real question is which platform helps operations adapt with fewer delays and fewer data losses.
Key data points that deserve close attention
Not all data has equal value. Some signals improve field decisions immediately, while others mainly support reporting, warranty control, or lifecycle planning.
A useful farm machinery platform comparison usually starts with the quality of the underlying data model. Raw volume matters less than consistency, timestamp accuracy, and event traceability.
Operational and machine-level metrics
- Engine load, fuel consumption, idle rate, and power delivery stability.
- Hydraulic response, transmission behavior, and traction performance under varying load.
- Downtime events, fault-code history, and remote diagnostic access.
- Firmware update frequency, rollback options, and change logs.
Field and agronomic metrics
- Yield mapping accuracy and cleaning-loss feedback on harvesters.
- Guidance precision, overlap reduction, and section-control performance.
- Application rate verification for seed, fertilizer, and crop protection inputs.
- Moisture sensing, irrigation timing logic, and water-use traceability.
A platform should also show how metrics relate across systems. For example, irrigation scheduling gains are more meaningful when linked to soil readings, crop stage, and machinery activity windows.
Integration quality often separates strong platforms from weak ones
Many platforms claim openness, but integration quality varies sharply. Some support only basic file export, while others enable live data exchange across controllers, farm software, and dealer service systems.
In a practical farm machinery platform comparison, three integration layers usually matter most: machine-to-machine compatibility, machine-to-software interoperability, and service-system connectivity.
The strongest systems reduce manual transfer points. They allow harvesting data, tractor settings, and irrigation triggers to move through the workflow without repeated re-entry or file cleaning.
AP-Strategy’s intelligence model is useful here because it treats machinery, precision agriculture, and water systems as connected assets rather than parallel categories.
The service gaps that create hidden cost
Service is often underweighted during evaluation. Yet platform value collapses quickly when software support, spare parts, or field response cannot keep pace with machine complexity.
In many cases, the visible problem is a failed update or unresolved fault code. The deeper issue is fragmented accountability between OEM systems, local dealers, and third-party components.
A careful farm machinery platform comparison should test service capability in realistic conditions, not only through brochure claims.
Warning signs to watch
- Remote support exists, but diagnostic permissions are limited.
- Local service teams handle mechanics well, but not software dependencies.
- Parts coverage is broad for tractors, yet weak for sensors or control modules.
- Update cycles improve features, but create compatibility risks with older implements.
- Data is collected extensively, but support teams cannot interpret it fast enough.
These gaps matter most during peak windows. A small integration failure during harvest or irrigation scheduling can trigger losses that far exceed the apparent software issue.
Where comparison criteria change by use case
No single scoring model fits every operation. A farm machinery platform comparison should reflect the production system, fleet diversity, and tolerance for downtime.
For large-scale tillage or transport, drivetrain durability, telematics stability, and service reach may dominate. In harvesting, cleaning-loss analytics, moisture correlation, and rapid service response usually matter more.
In precision application, variable-rate execution and guidance consistency become central. For irrigation-linked systems, sensor integration, forecasting logic, and water-accounting transparency move higher on the list.
Mixed fleets add another layer. A platform may be powerful within one brand family yet become restrictive when third-party tools or legacy machines must remain in service.
A practical way to evaluate platforms
Useful comparisons usually combine technical review with scenario testing. That means checking whether the platform performs under the kinds of interruptions that happen in the field.
- Map the required data chain from machine sensor to final decision screen.
- Test one real workflow, such as harvest-loss adjustment or irrigation scheduling.
- Review API or export structure before committing to long-term integration.
- Ask for update policy details, service escalation timing, and compatibility notes.
- Separate headline features from features supported across all regions and seasons.
This method helps avoid a common mistake. Platforms are often compared by visible interface quality while deeper constraints in data architecture or support capacity stay untested.
Building a stronger decision framework
A reliable farm machinery platform comparison should end with a weighted framework, not a simple ranking. Data quality, integration readiness, and service resilience deserve equal attention alongside machine specifications.
That is also where intelligence sources add value. AP-Strategy’s focus on combine technology, tractor chassis, intelligent tools, and water-saving systems reflects how platform performance now crosses traditional product boundaries.
The next step is to define the operating scenarios that matter most, then compare platforms against those scenarios using measurable criteria. Clearer standards at this stage usually prevent expensive surprises later.
When the comparison is grounded in field data, interoperability, and service reality, platform selection becomes less about marketing claims and more about durable operational fit.
Related News
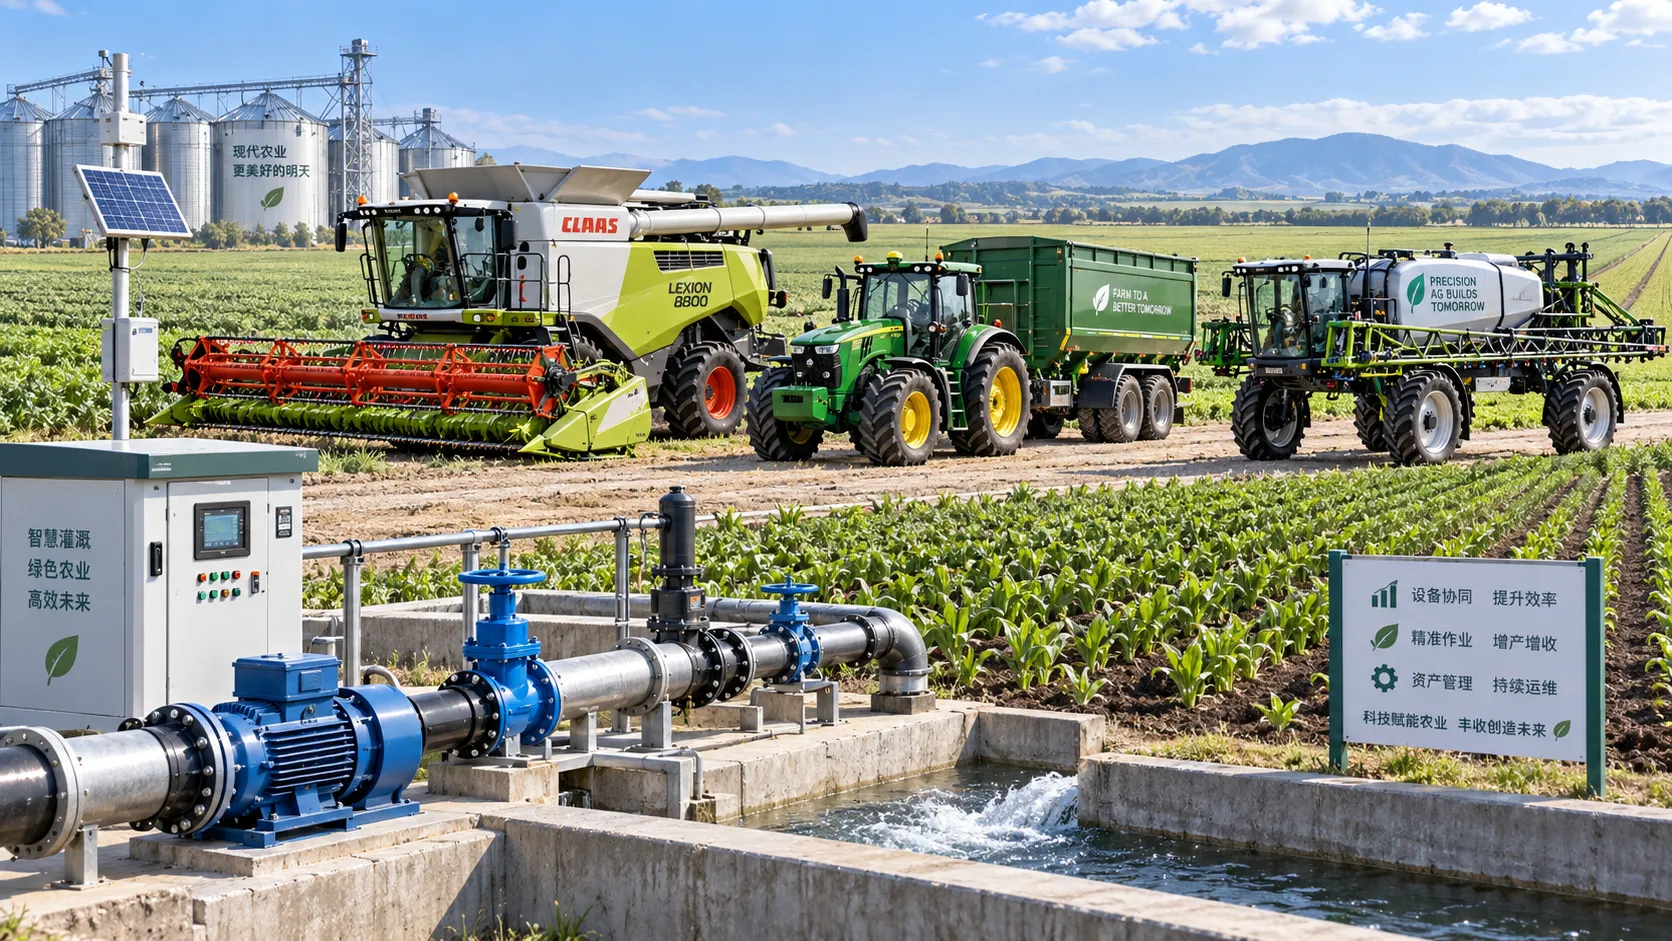
How to Compare Agricultural Equipment Platforms for Fleet Management and ROI
Agricultural equipment platform comparison: evaluate fleet data, maintenance, precision workflows, and ROI to choose a system that delivers measurable results.
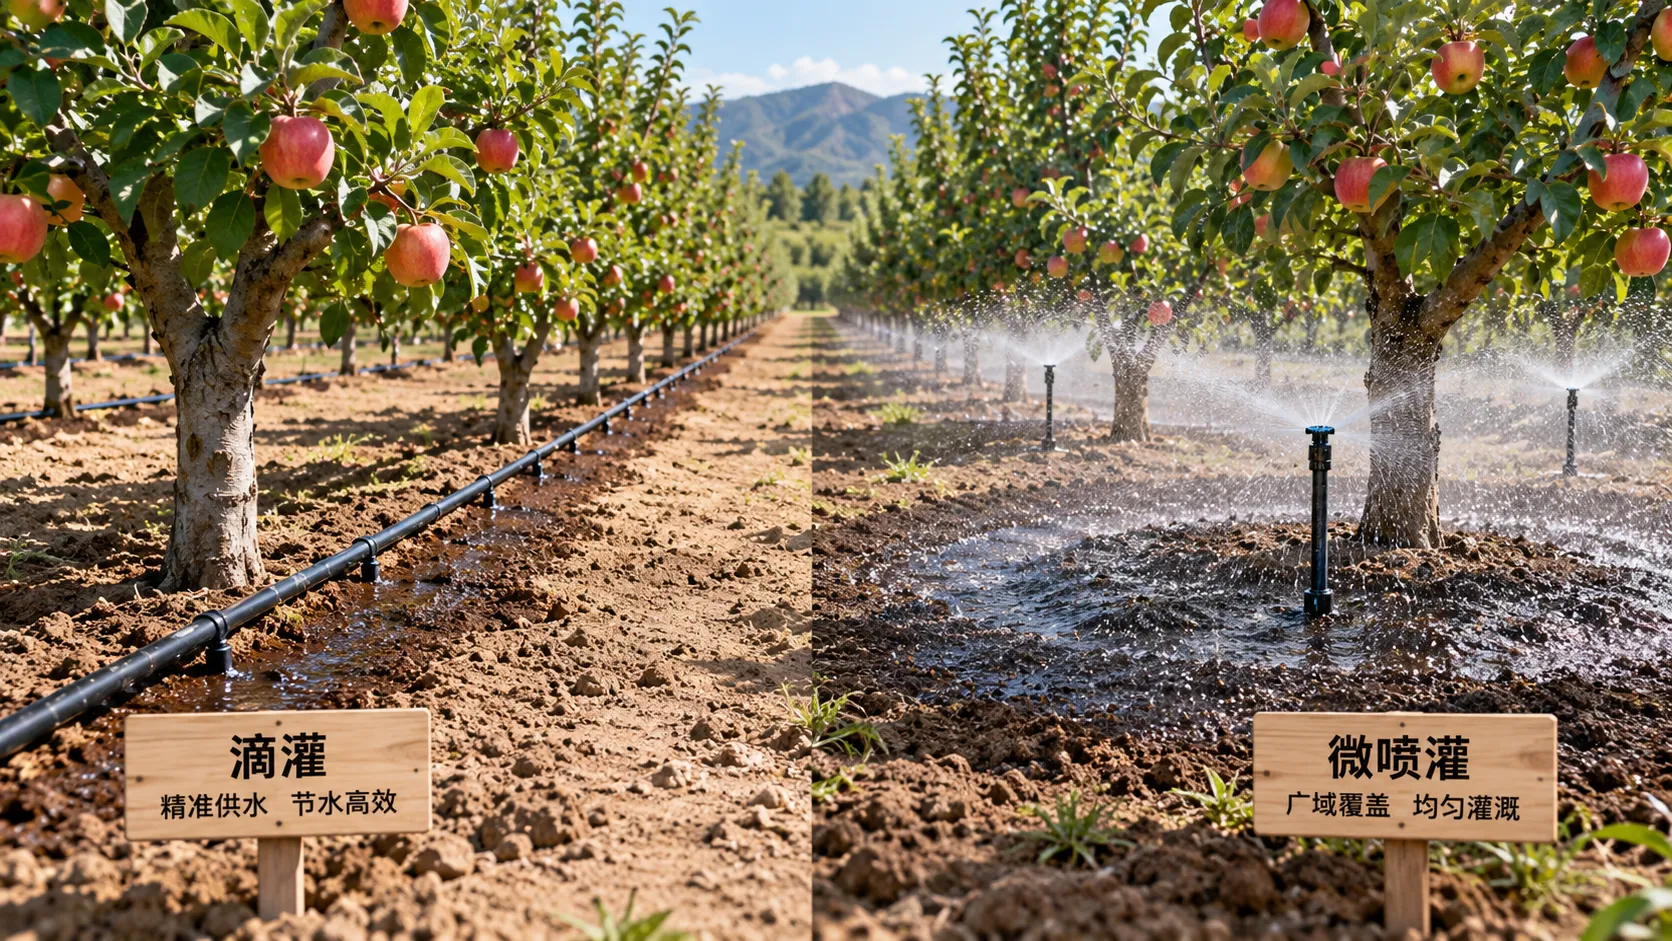
Drip vs. Micro-Sprinkler Irrigation: Which System Fits Your Orchard?
Irrigation solution comparison for orchards: discover whether drip or micro-sprinklers best match your water, soil, roots, fertigation, and frost needs.
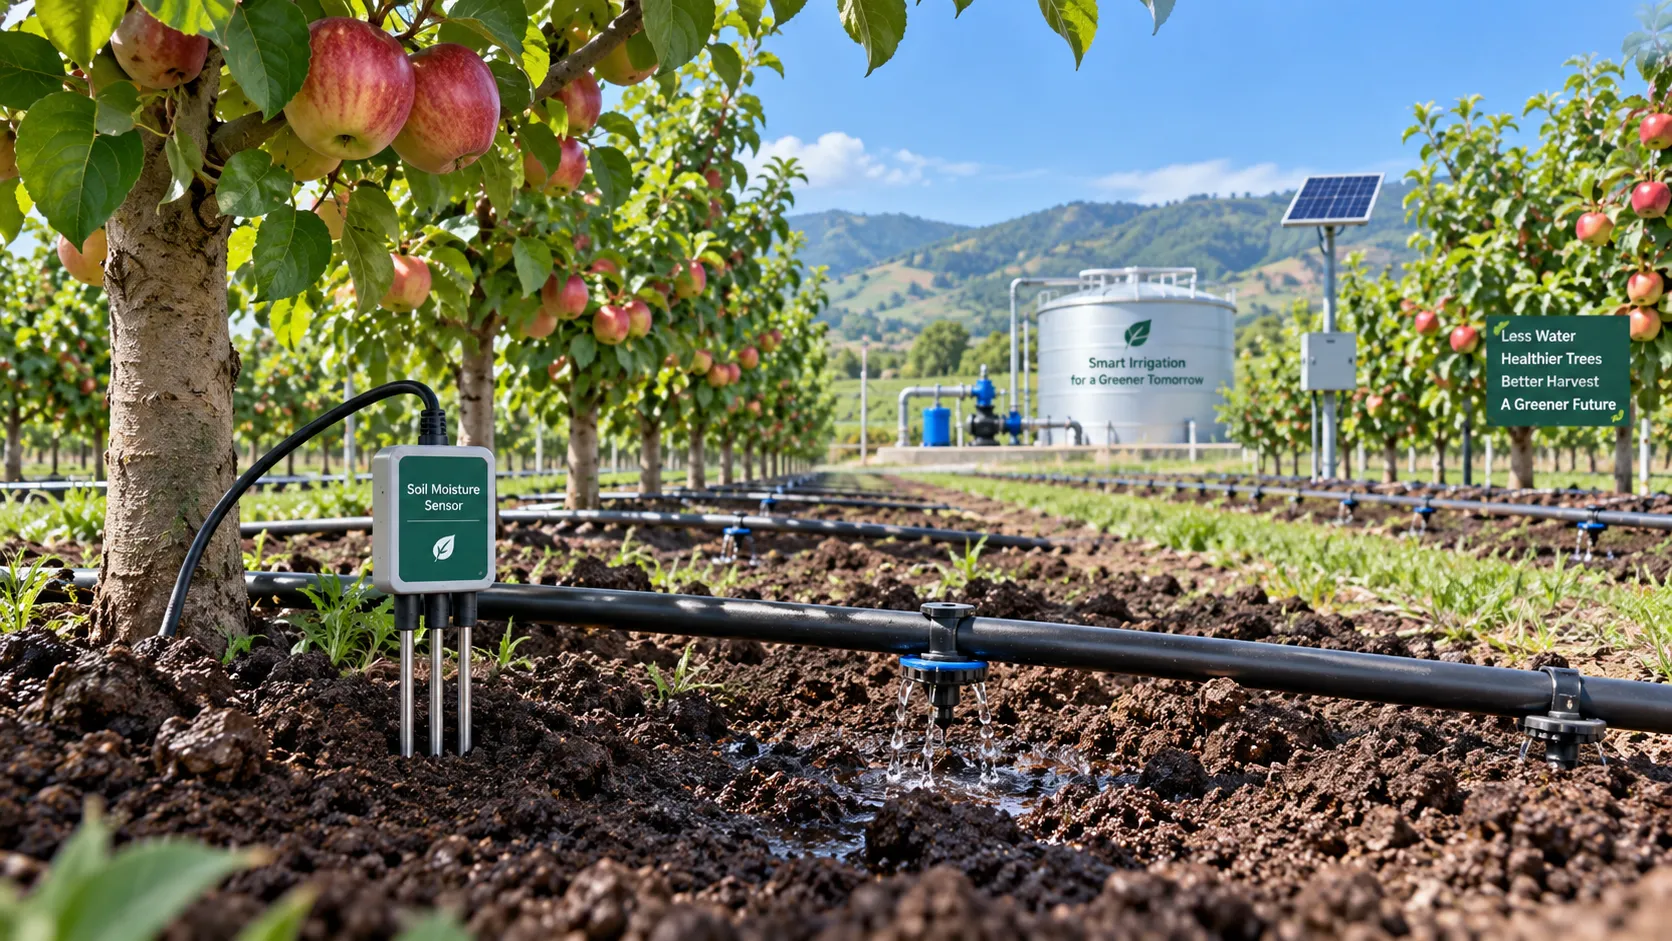
Orchard Water Management: Using Soil Moisture Data to Schedule Irrigation
Agricultural water management for orchards made practical: use soil moisture data to optimize irrigation timing, protect yield, reduce costs, and improve resilience.
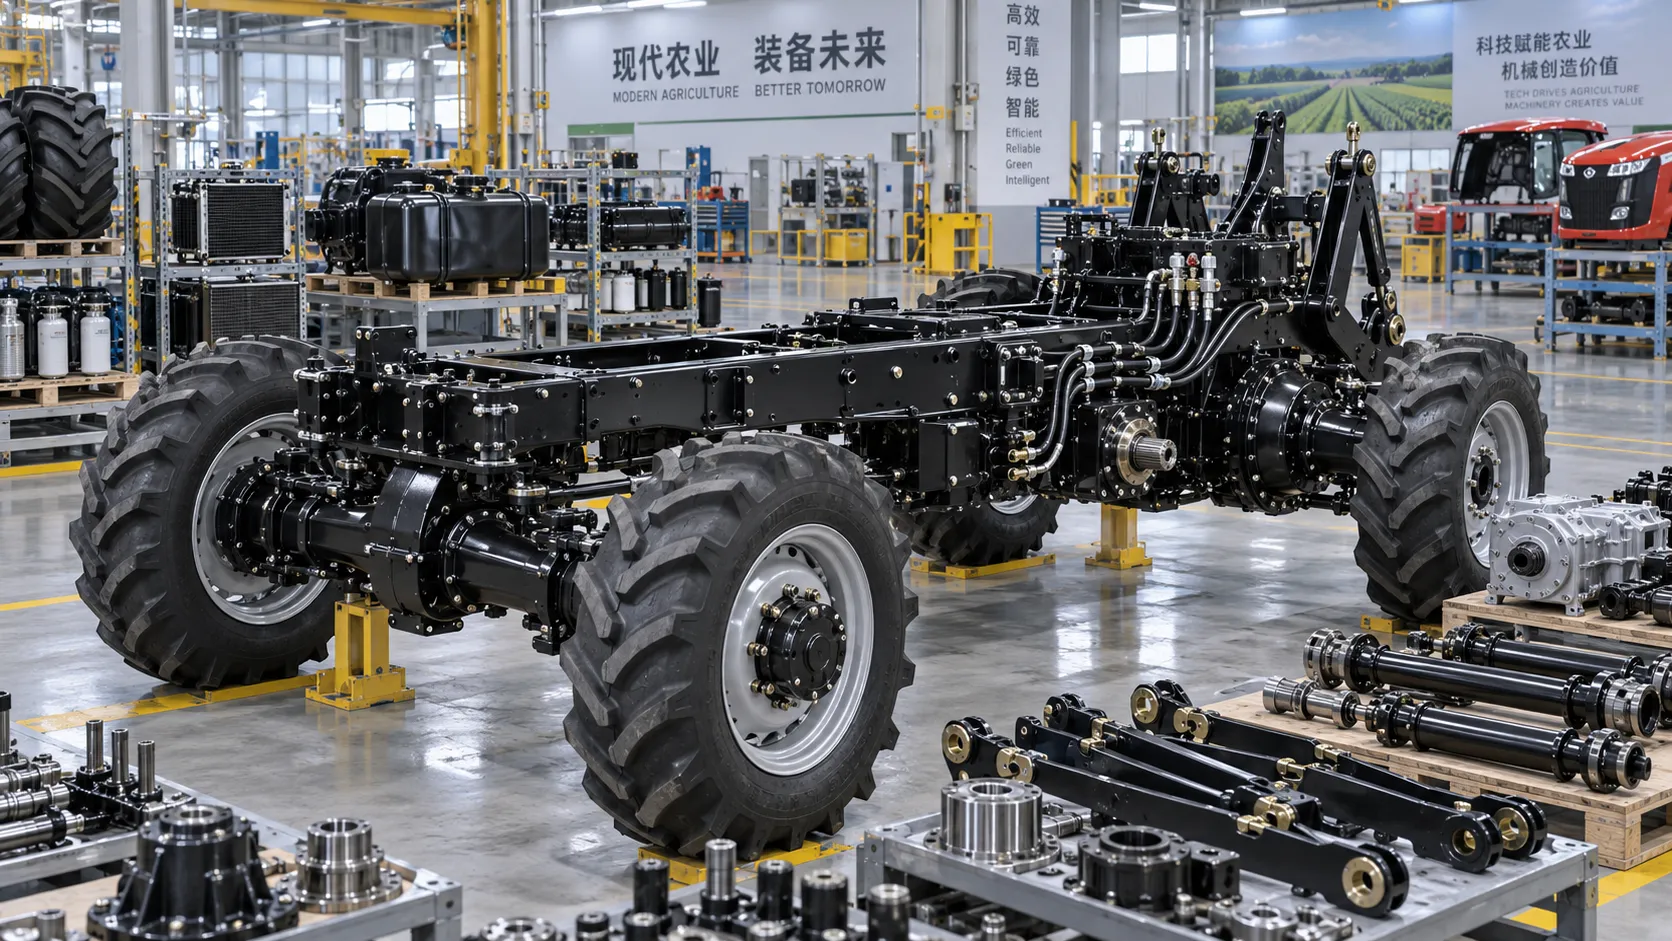
Tractor Chassis Price: What Buyers Should Compare Beyond the Initial Quote
Tractor chassis price is only the start. Compare load capacity, compatibility, durability, and lifecycle costs to choose a reliable, high-value chassis.
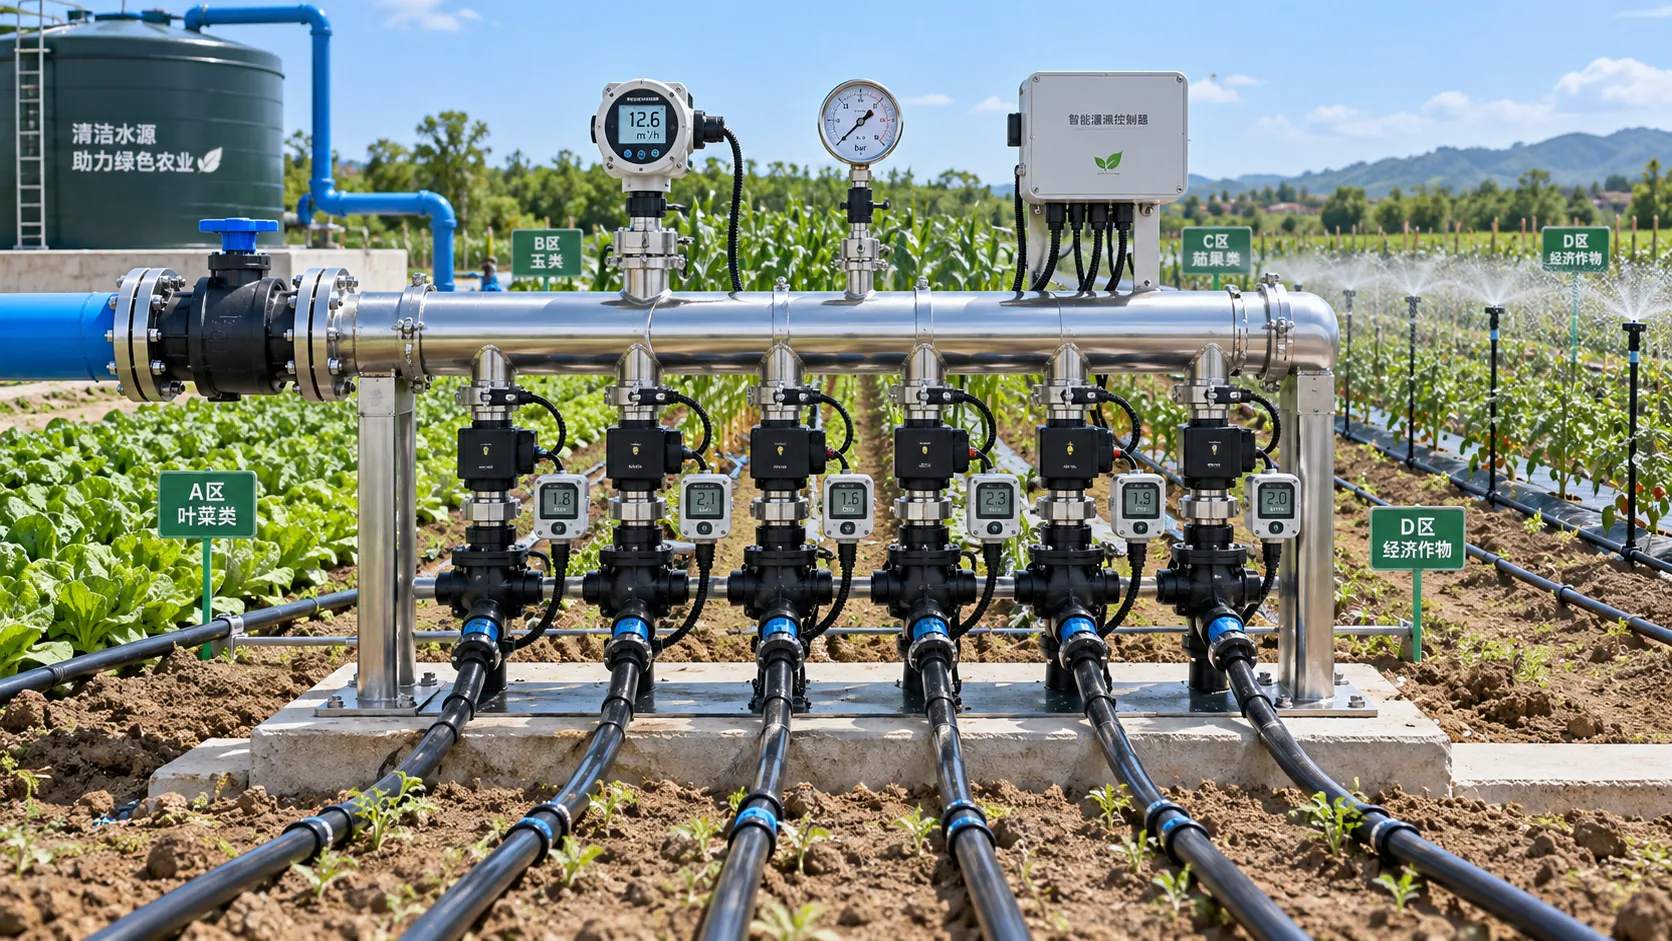
How to Select Smart Irrigation Valves for Multi-Zone Water Management?
Intelligent irrigation systems valves: learn how to match smart valves with multi-zone flow, pressure, control, feedback, and communication needs for reliable water management.
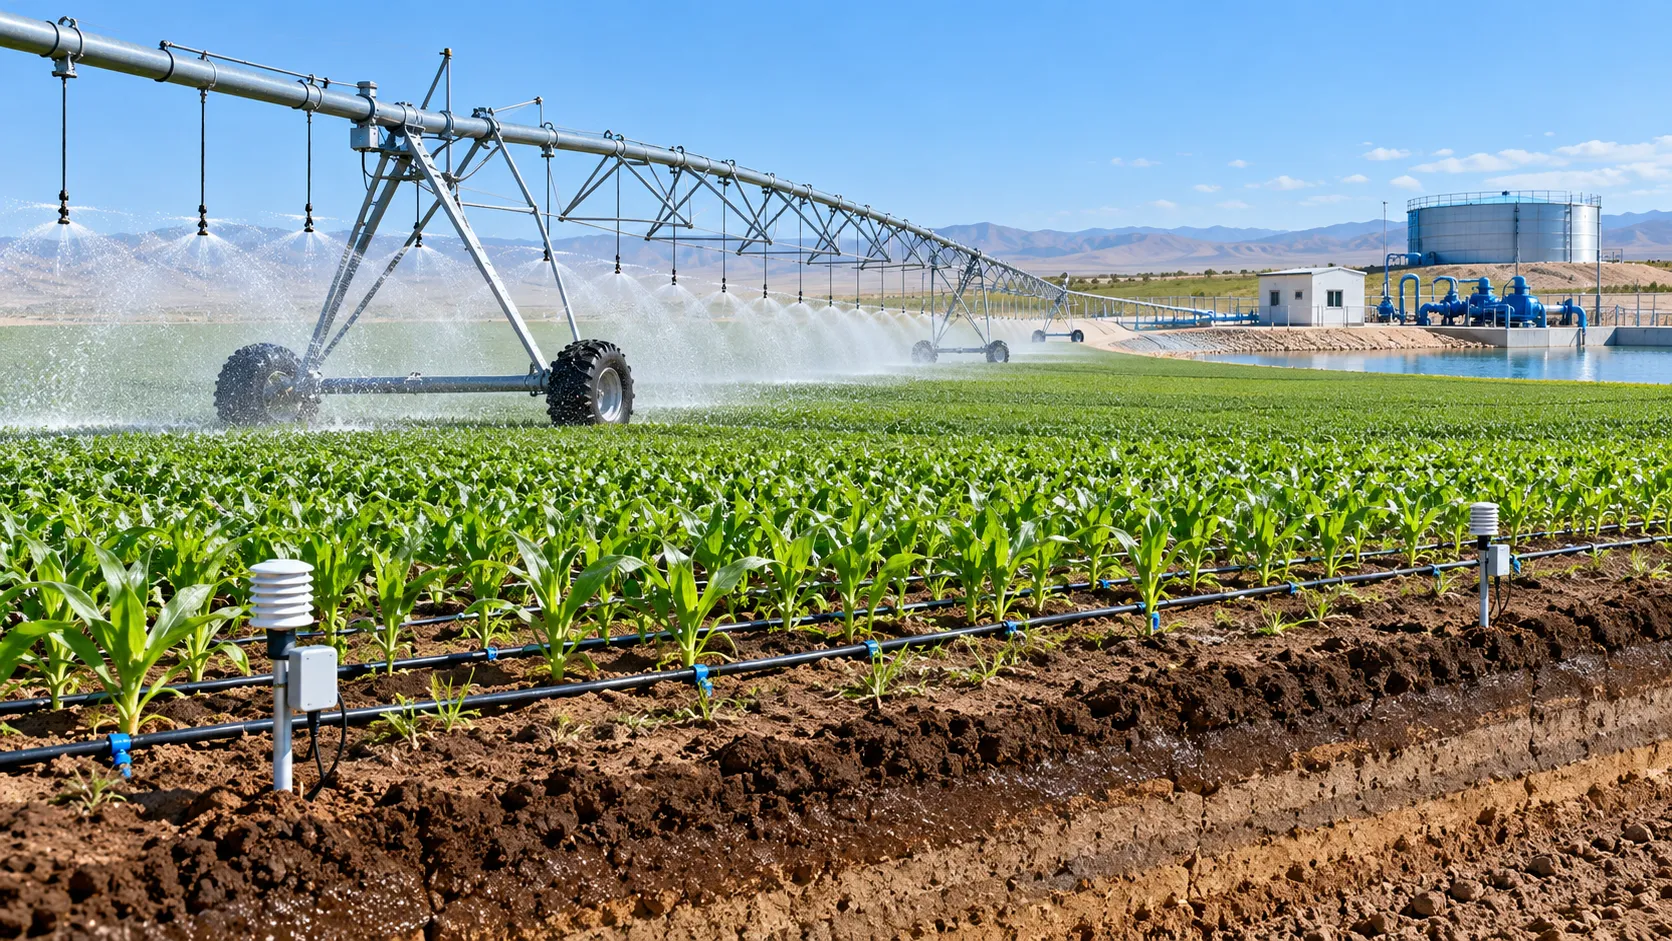
Climate-Smart Farming for Drought: A Practical Plan for Protecting Yields
Climate-smart farming for drought: build smarter water budgets, protect critical crop stages, improve irrigation uniformity, and safeguard yields with practical field-proven strategies.
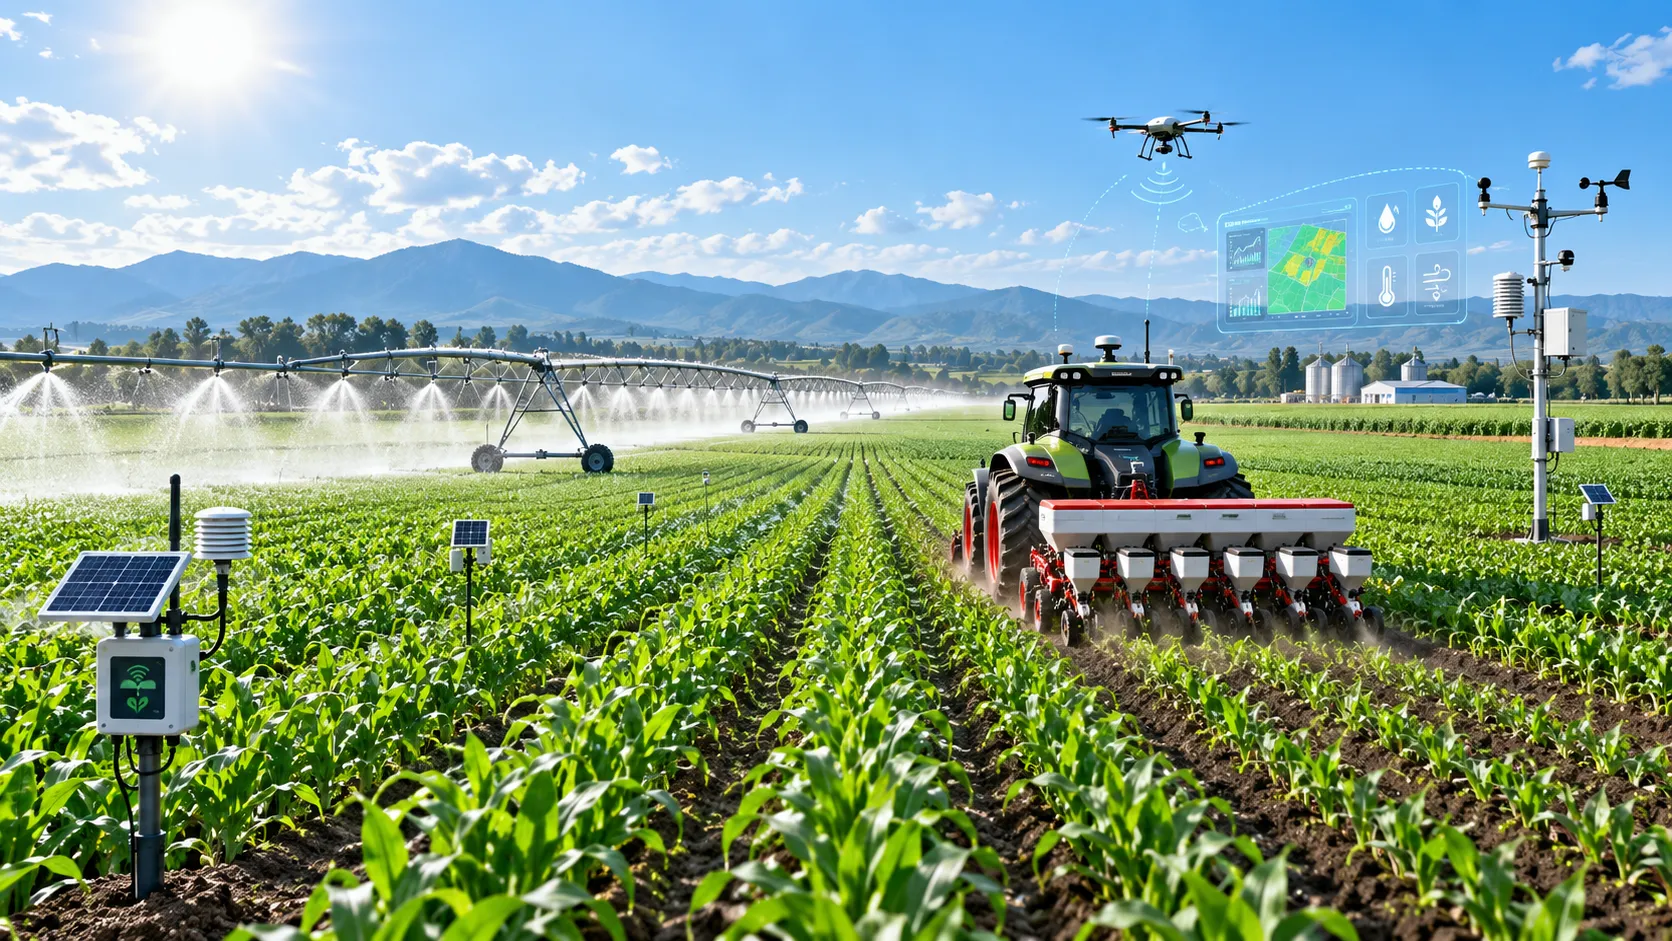
How Digital Agriculture Platforms Turn Field Data Into Better Input Decisions
Digital agriculture platforms turn field data into smarter fertilizer, water, seed, and equipment decisions—helping farms cut risk, improve margins, and scale sustainability.
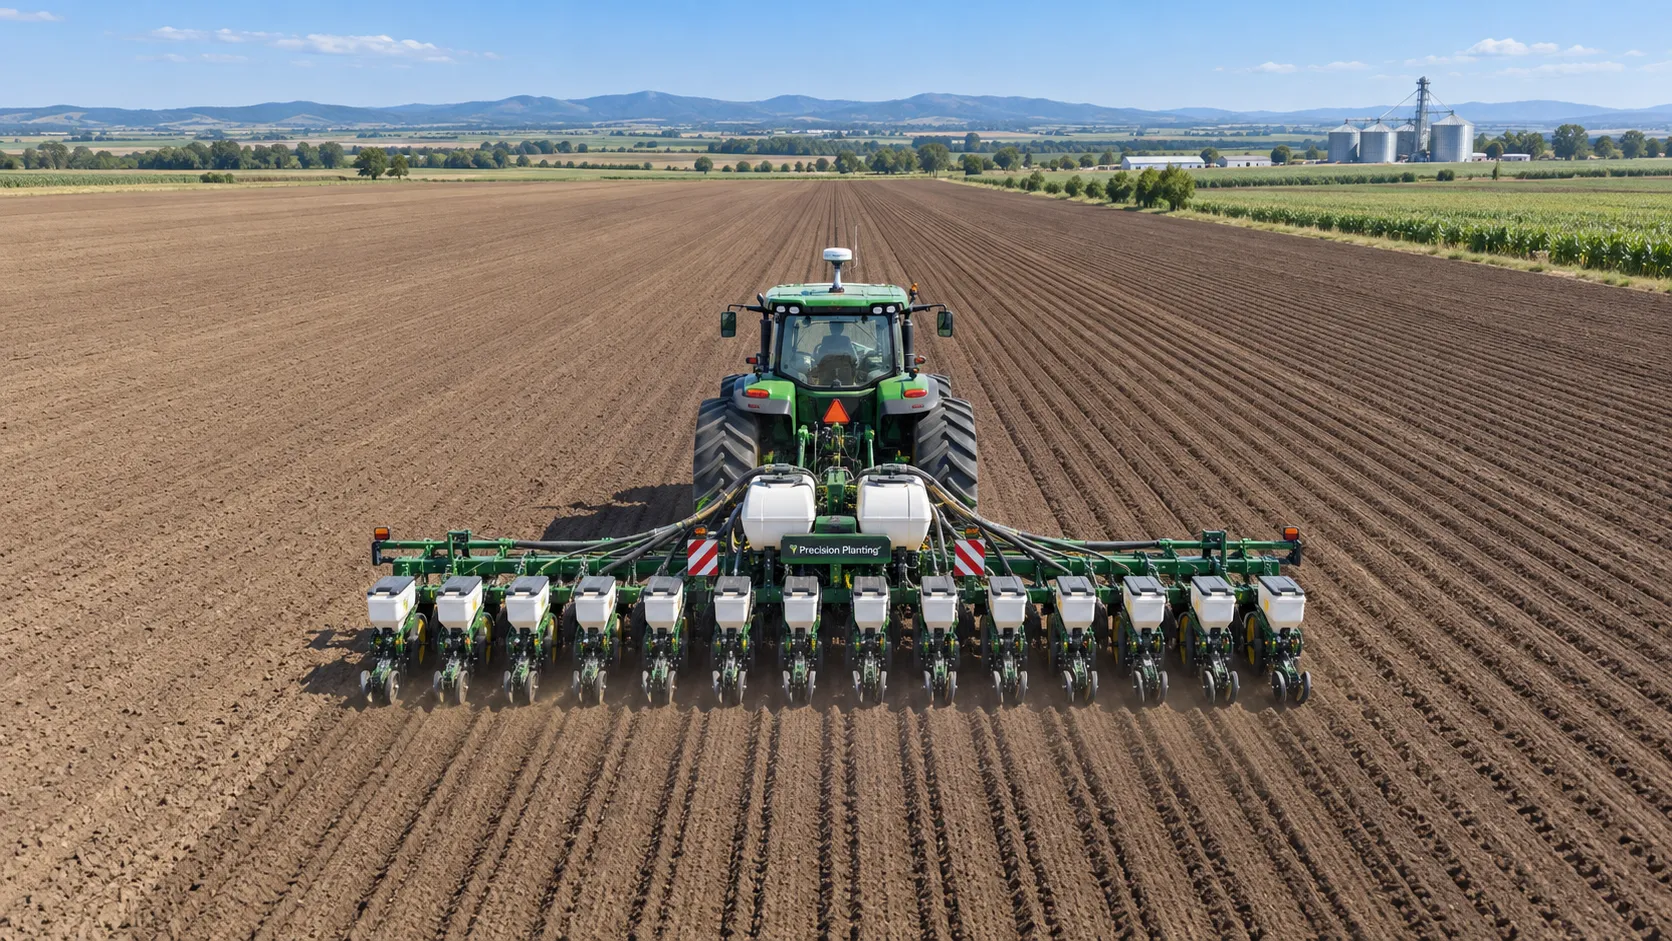
GPS-Guided Farm Machinery: Where It Delivers Measurable Field Efficiency Gains
Agri-mechanization GPS guided systems deliver measurable field efficiency gains through reduced overlap, precise planting, smarter inputs, and reliable farm data.
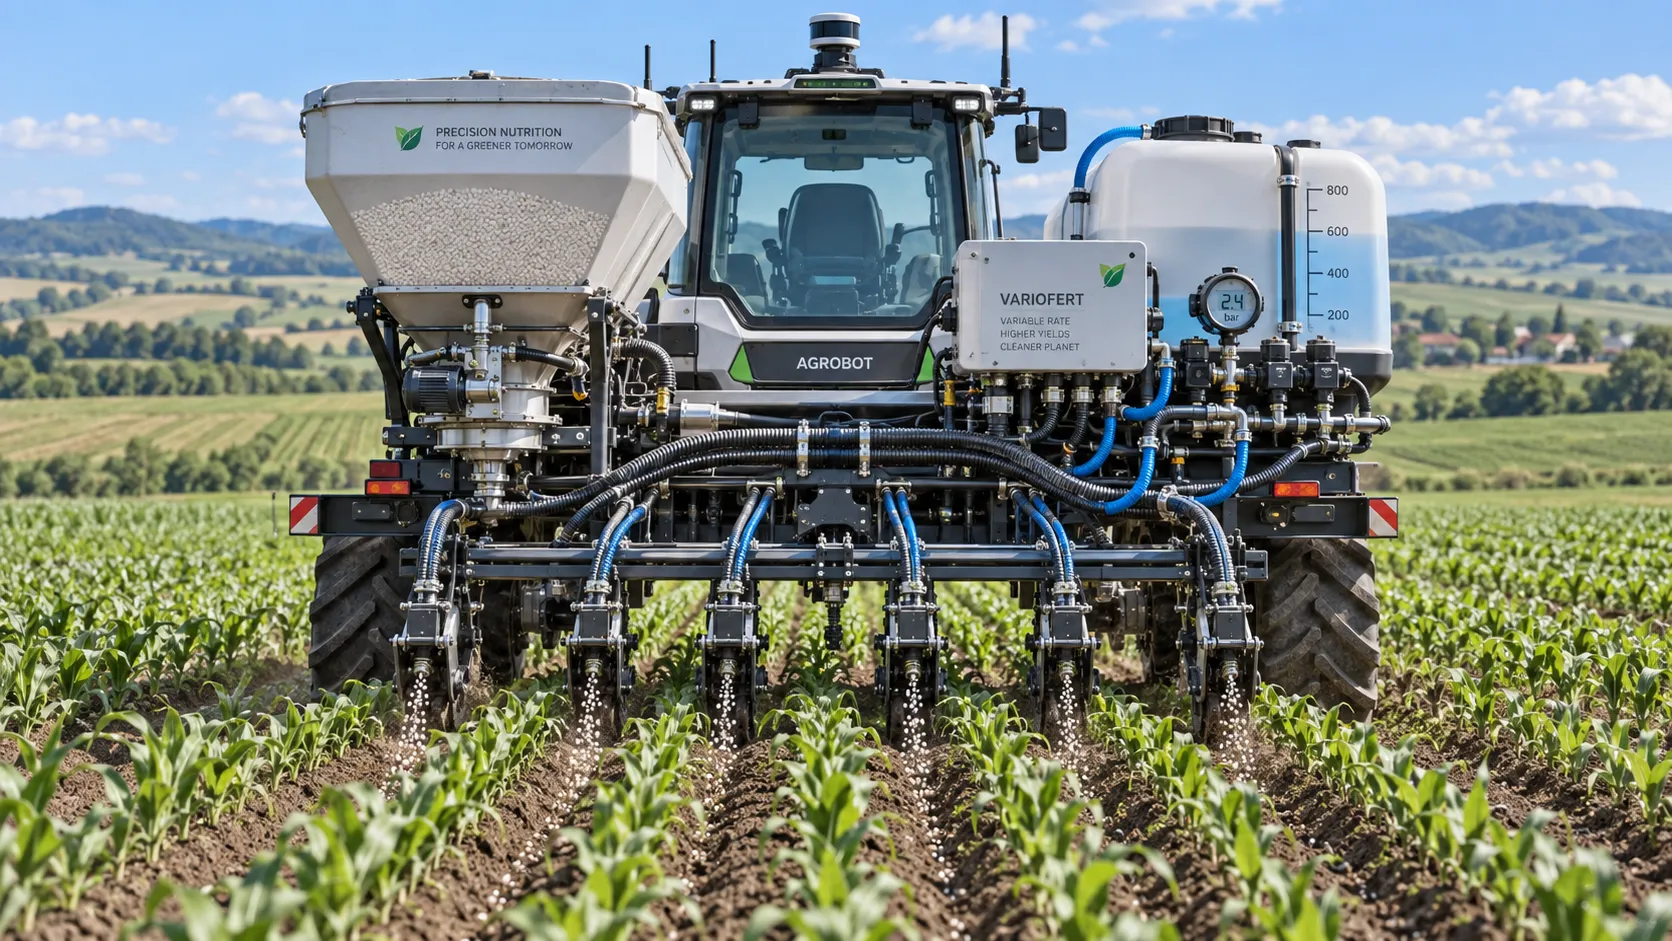
How Sensor Feedback Enables Accurate Variable-Rate Fertilization in Field Conditions
Precision fertilization systems with sensor feedback improve variable-rate accuracy by verifying flow, managing latency, and ensuring reliable field application.
Related News
- 00
0000-00
How to Compare Agricultural Equipment Platforms for Fleet Management and ROI - 00
0000-00
Tractor Chassis Price: What Buyers Should Compare Beyond the Initial Quote - 00
0000-00
How Digital Agriculture Platforms Turn Field Data Into Better Input Decisions - 00
0000-00
When Does Agricultural Machinery Leasing Cost Less Than Owning Equipment? - 00
0000-00
Selecting Grain Farm Equipment by Acreage, Crop Mix, and Harvest Window
Popular Tags
Ms. Elena Rodriguez
Weekly Insights
Stay ahead with our curated technology reports delivered every Monday.